

🔺 Overview
⸻⸻⸻⸻⸻⸻⸻⸻⸻
📈 Key Price Action
⸻⸻⸻⸻⸻⸻⸻⸻⸻
📊 Chart Explanation
⸻⸻⸻⸻⸻⸻⸻⸻⸻
👀 Observation
⸻⸻⸻⸻⸻⸻⸻⸻⸻
🔮 Future Outlook
⸻⸻⸻⸻⸻⸻⸻⸻⸻
🧠 Summary
⸻⸻⸻⸻⸻⸻⸻⸻⸻
⚠️ Disclaimer
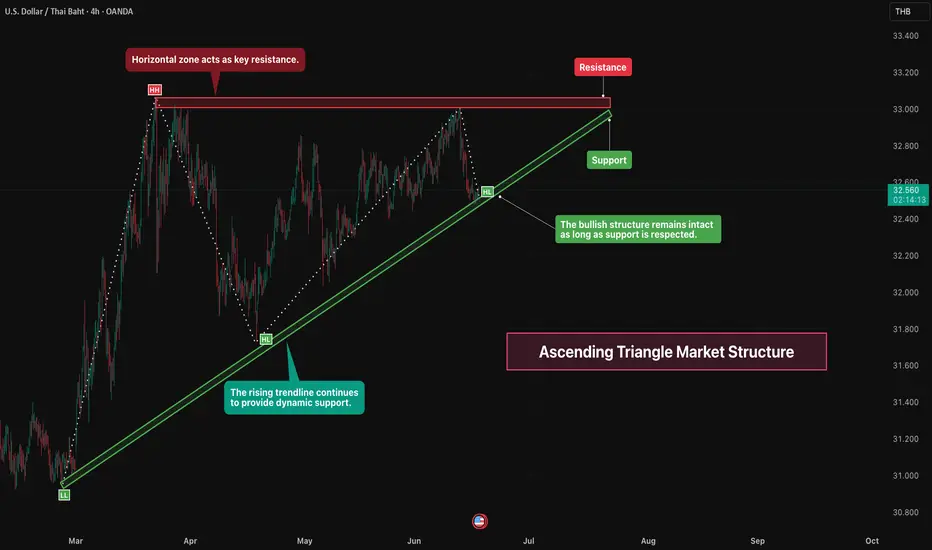
This chart highlights an ascending triangle market structure, where price is trading between a rising support trendline and a horizontal resistance zone. The pattern reflects strengthening demand as higher lows continue to develop.
⸻⸻⸻⸻⸻⸻⸻⸻⸻
📈 Key Price Action
• Higher lows indicate sustained buying pressure.
• Price continues to respect the rising trendline support.
• Multiple tests of the resistance zone confirm its significance.
• The market remains compressed between support and resistance.
⸻⸻⸻⸻⸻⸻⸻⸻⸻
📊 Chart Explanation
• The rising trendline continues to provide dynamic support.
• The horizontal zone acts as a key resistance area.
• Higher lows reinforce the bullish market structure.
• The ascending triangle pattern remains valid while support holds.
⸻⸻⸻⸻⸻⸻⸻⸻⸻
👀 Observation
• Buyers continue defending higher price levels.
• Resistance remains the key level to watch.
• Price is approaching a decision area between support and resistance.
• Volatility may expand as price moves closer to the triangle apex.
⸻⸻⸻⸻⸻⸻⸻⸻⸻
🔮 Future Outlook
• Holding above support may favor continued bullish structure.
• A breakout above resistance could strengthen upward momentum.
• A loss of trendline support may weaken the current market structure.
• Confirmation through candle closing behavior can improve reliability.
⸻⸻⸻⸻⸻⸻⸻⸻⸻
🧠 Summary
Price remains within an ascending triangle structure, supported by a rising trendline and capped by a well-defined resistance zone. The current market structure remains constructive while support is respected.
⸻⸻⸻⸻⸻⸻⸻⸻⸻
⚠️ Disclaimer
📘 For educational purposes only.
🙅 Not SEBI registered.
❌ Not a buy/sell recommendation.
🧠 Purely a learning resource.
📊 Not Financial Advice.

Pine Script Developer • Market Analysis
免责声明
这些信息和出版物并非旨在提供,也不构成TradingView提供或认可的任何形式的财务、投资、交易或其他类型的建议或推荐。请阅读使用条款了解更多信息。
Pine Script Developer • Market Analysis
免责声明
这些信息和出版物并非旨在提供,也不构成TradingView提供或认可的任何形式的财务、投资、交易或其他类型的建议或推荐。请阅读使用条款了解更多信息。