

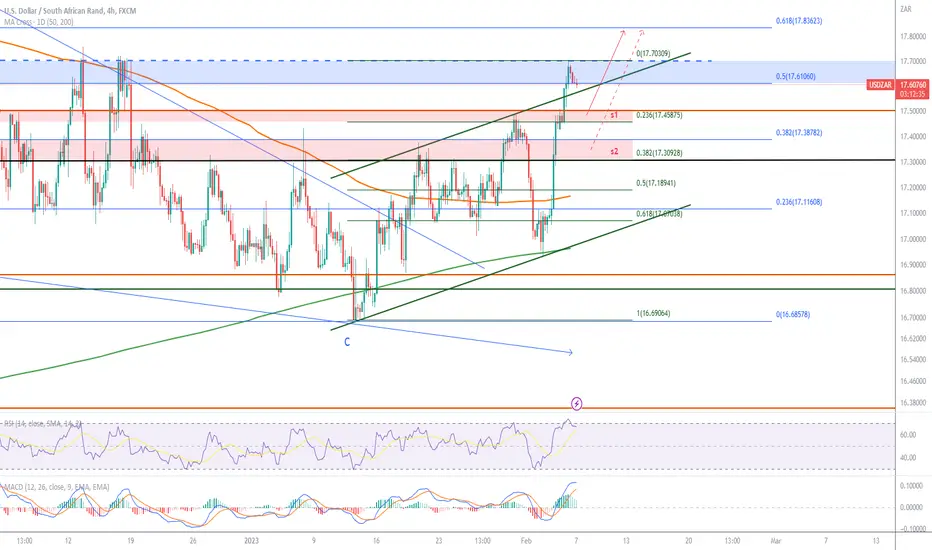
The dollar strength following Friday’s strong non-farm payrolls print continued in yesterday’s session which allowed the USDZAR pair to break through the blue 50% Fibo retracement rate of 17.61. The pair seems to have lost some upward momentum after hitting a high of 17.70. The rate of 17.61 will swing from a resistance to a support and a break below it will allow the rand to pull the pair onto the neckline of the updated green parallel channel and lower towards the orange 23.6% Fibo retracement rate of 17.50 (I’ll drop a daily timeframe in the comments for context) and the green 23.6% Fibo retracement rate of 17.46 (support range 1).
Fundamentally there is not much supporting a strong pullback for the rand so the red zone between 17.46 and 17.50 is looking like an attractive buy zone (s1). The January risk-on sentiment was dealt a reality check last week which has seen dollar strengthen across the board and US equity markets are looking poised to pull back from their current overbought zones, which is rand negative. In that breath, it is however not unlikely that we see a deeper pullback into the range between 17.30 and 17.38 (s2).
Technical indicators on the 4H chart is supporting this pullback; the RSI is trending downwards after falling out of the overbought zone and the buy signal of the MACD is losing momentum and may switch to a sell signal if the expected pull back materializes. Regarding our daily indicators, the RSI is still trending higher and the MACD buy signal is still solid.
Looking over at the DXY, the index hit its 50-day MA resistance rate at 103.642 and its technical indicators are also supportive of a pullback for the greenback.

Fundamentally there is not much supporting a strong pullback for the rand so the red zone between 17.46 and 17.50 is looking like an attractive buy zone (s1). The January risk-on sentiment was dealt a reality check last week which has seen dollar strengthen across the board and US equity markets are looking poised to pull back from their current overbought zones, which is rand negative. In that breath, it is however not unlikely that we see a deeper pullback into the range between 17.30 and 17.38 (s2).
Technical indicators on the 4H chart is supporting this pullback; the RSI is trending downwards after falling out of the overbought zone and the buy signal of the MACD is losing momentum and may switch to a sell signal if the expected pull back materializes. Regarding our daily indicators, the RSI is still trending higher and the MACD buy signal is still solid.
Looking over at the DXY, the index hit its 50-day MA resistance rate at 103.642 and its technical indicators are also supportive of a pullback for the greenback.

免责声明
这些信息和出版物并非旨在提供,也不构成TradingView提供或认可的任何形式的财务、投资、交易或其他类型的建议或推荐。请阅读使用条款了解更多信息。