
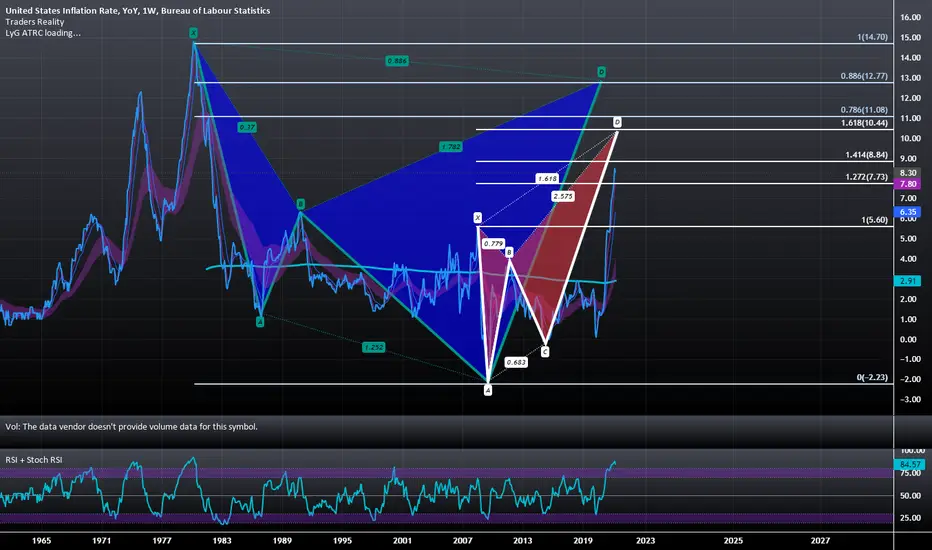
If we are to base our views of this chart like we would any other price chart, the harmonics we see forming here would imply that US Inflation is reaching a peak and that we will see Inflation come down signfiicantly over the the coming years. If i were to give a target i'd say we'd wanna see it come down to atlest 3% as a first target but it could go down even more depending on how tight things get.
The smaller harmonic is a Bearish Butterfly with a reversal zone between the 1.272 and 1.618 and the bigger one if we get that high is a Bearish Shark. Ideally we'd like to see the Butterfly playout and us not to have to go as high as the Shark.
The smaller harmonic is a Bearish Butterfly with a reversal zone between the 1.272 and 1.618 and the bigger one if we get that high is a Bearish Shark. Ideally we'd like to see the Butterfly playout and us not to have to go as high as the Shark.

免责声明
这些信息和出版物并非旨在提供,也不构成TradingView提供或认可的任何形式的财务、投资、交易或其他类型的建议或推荐。请阅读使用条款了解更多信息。
免责声明
这些信息和出版物并非旨在提供,也不构成TradingView提供或认可的任何形式的财务、投资、交易或其他类型的建议或推荐。请阅读使用条款了解更多信息。