
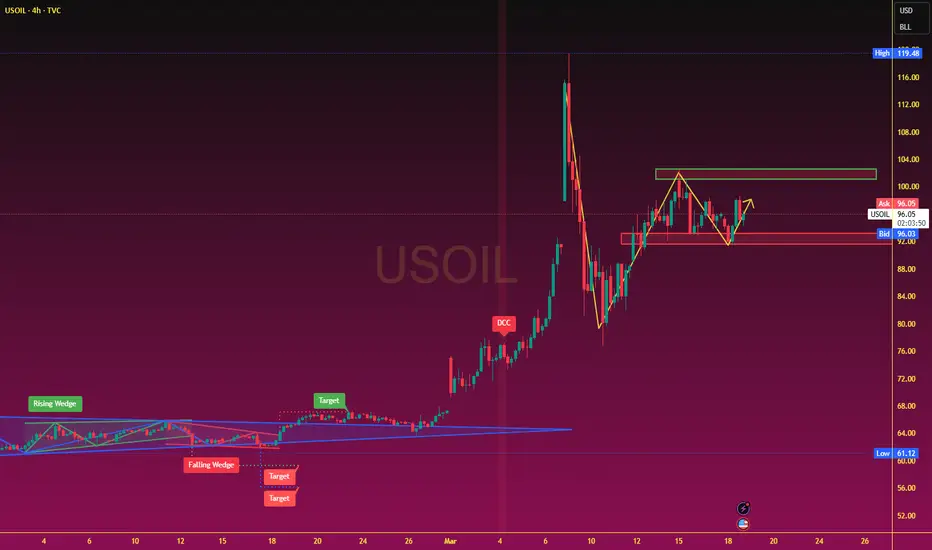
On the daily chart, oil prices surged above $110 due to geopolitical and macroeconomic influences. The moving average system is diverging upwards, indicating an upward trend in the medium term. The price action is currently in a secondary consolidation at higher levels, supported by the price action, but bullish momentum remains strong. The medium-term trend is expected to remain bullish. In the short term, crude oil is repeatedly crossing the moving average system, indicating a mainly volatile short-term trend. The range is expected to be between $105.60 and $91.00. The MACD indicator has broken upwards near the zero line, suggesting potential for further upward movement.
Trading Analysis: Crude oil broke through the resistance level around $96.3, which is expected to form new support. Today, the strategy is to prioritize buying on pullbacks, with selling on rallies as a secondary approach. Key resistance levels to watch are $101.5-$102.5, and key support levels are $97.5-$96.0.
Trading Summary: The key to success lies in consistently focusing on these detailed and accurate trading signals or real-time information. Traders who consistently follow these signals will ultimately succeed.

免责声明
这些信息和出版物并非旨在提供,也不构成TradingView提供或认可的任何形式的财务、投资、交易或其他类型的建议或推荐。请阅读使用条款了解更多信息。
免责声明
这些信息和出版物并非旨在提供,也不构成TradingView提供或认可的任何形式的财务、投资、交易或其他类型的建议或推荐。请阅读使用条款了解更多信息。