
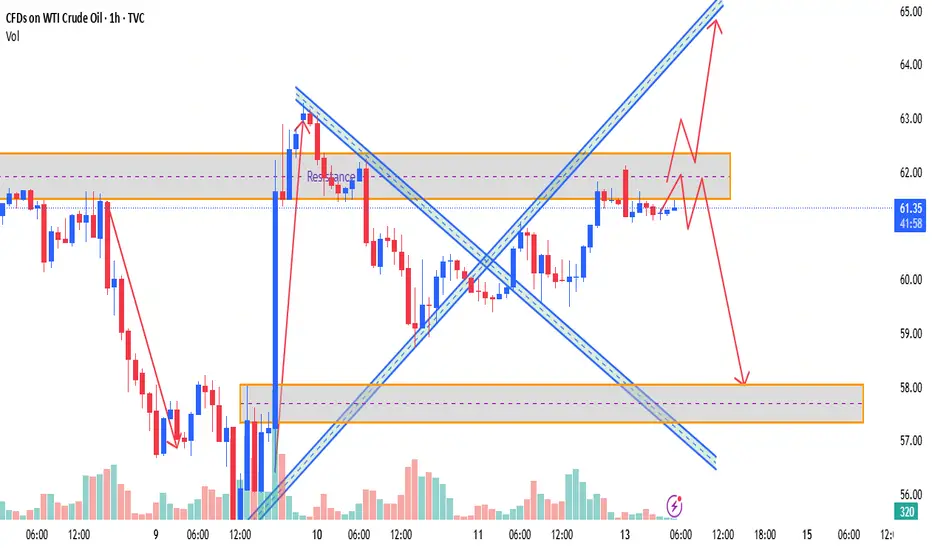
Chart Overview:
WTI Crude is trading around 61.44, consolidating inside a key resistance zone near62.00. After a strong bullish impulse, price has stalled under this resistance, forming both bullish and bearish paths, highlighting a conflicting market structure
Key Discrepations Identified:
1. Bullish Momentum vs. Resistance Reaction
- Expected: Continuation to 64+ after breakout.
- Reality: Price is struggling below resistance, rejecting upper boundary multiple times.
- Discrepation: Bullish momentum is slowing, and repeated rejections are exposing potential reversal pressure.
2. Volume Strength vs. Breakout Potential
- Volume d…
- Visually this implies strength, but price is hovering in indecision, neither breaking up nor down convincingly.
- Discrepation: Chart setup shows both bullish continuation and bearish breakdown possibilities, confusing structure
4. Double Scenario Projection
- The projection shows both:
- A bullish breakout to 64.
- A rejection and selloff to 58.
- Discrepation: Market is giving mixed technical signals, suggesting traders should wait for confirmation before committing
Discrepation Summary Table:
| Element | Expectation | Observed Reality | Discrepation | Projection Conflict | Clear trend continuation | Dual projection shown | Market indecision + low conviction |
📉 Conclusion:
While WTI remains inside a short-term bullish structure, the presence of conflicting breakout signals, resistance rejections, and declining volume point toward a discrepation. Traders should watch the 62.00 resistance zone closely. A clear rejection or breakout will resolve this divergence, with downside targeting 58.00, and upside toward $64.00.
Let me know if you'd like a summarized version for a caption or post!
WTI Crude is trading around 61.44, consolidating inside a key resistance zone near62.00. After a strong bullish impulse, price has stalled under this resistance, forming both bullish and bearish paths, highlighting a conflicting market structure
Key Discrepations Identified:
1. Bullish Momentum vs. Resistance Reaction
- Expected: Continuation to 64+ after breakout.
- Reality: Price is struggling below resistance, rejecting upper boundary multiple times.
- Discrepation: Bullish momentum is slowing, and repeated rejections are exposing potential reversal pressure.
2. Volume Strength vs. Breakout Potential
- Volume d…
- Visually this implies strength, but price is hovering in indecision, neither breaking up nor down convincingly.
- Discrepation: Chart setup shows both bullish continuation and bearish breakdown possibilities, confusing structure
4. Double Scenario Projection
- The projection shows both:
- A bullish breakout to 64.
- A rejection and selloff to 58.
- Discrepation: Market is giving mixed technical signals, suggesting traders should wait for confirmation before committing
Discrepation Summary Table:
| Element | Expectation | Observed Reality | Discrepation | Projection Conflict | Clear trend continuation | Dual projection shown | Market indecision + low conviction |
📉 Conclusion:
While WTI remains inside a short-term bullish structure, the presence of conflicting breakout signals, resistance rejections, and declining volume point toward a discrepation. Traders should watch the 62.00 resistance zone closely. A clear rejection or breakout will resolve this divergence, with downside targeting 58.00, and upside toward $64.00.
Let me know if you'd like a summarized version for a caption or post!

免责声明
这些信息和出版物并非旨在提供,也不构成TradingView提供或认可的任何形式的财务、投资、交易或其他类型的建议或推荐。请阅读使用条款了解更多信息。
免责声明
这些信息和出版物并非旨在提供,也不构成TradingView提供或认可的任何形式的财务、投资、交易或其他类型的建议或推荐。请阅读使用条款了解更多信息。