
Hi Traders!
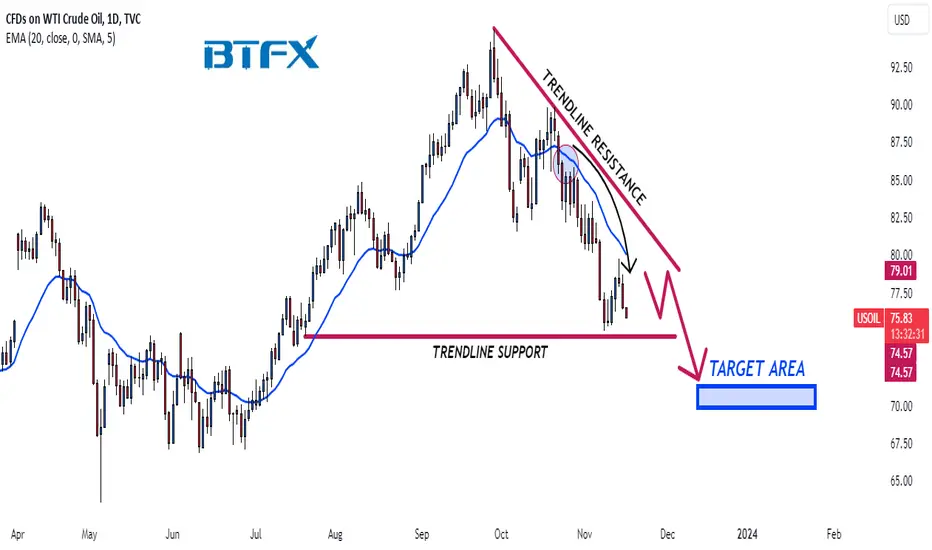
The bearish price action continues on the USOIL 1D chart, and there may be possible opportunities for short entries.
Price Action 📊
The market has had lower highs and lower lows since breaking below the 3-month low and 20 EMA, creating a descending triangle pattern on the chart.
We are looking for further bearish momentum to break and close the trendline support line and continue to the downside.
Fundamental Analysis 📰
The market's outlook on USOIL is currently negative due to continuing dips in oil prices following tensions in the Middle East.
Support 📉
74.57: TRENDLINE SUPPORT
Resistance 📈
79.01: TRENDLINE RESISTANCE
Risk ⚠️
No more than 2% of your capital.
Reward 💰
At least 4% of your capital.
Please make sure to click on the like/boost button 🚀 as your support greatly helps.
Trade safely and responsibly.
BluetonaFX
The bearish price action continues on the USOIL 1D chart, and there may be possible opportunities for short entries.
Price Action 📊
The market has had lower highs and lower lows since breaking below the 3-month low and 20 EMA, creating a descending triangle pattern on the chart.
We are looking for further bearish momentum to break and close the trendline support line and continue to the downside.
Fundamental Analysis 📰
The market's outlook on USOIL is currently negative due to continuing dips in oil prices following tensions in the Middle East.
Support 📉
74.57: TRENDLINE SUPPORT
Resistance 📈
79.01: TRENDLINE RESISTANCE
Risk ⚠️
No more than 2% of your capital.
Reward 💰
At least 4% of your capital.
Please make sure to click on the like/boost button 🚀 as your support greatly helps.
Trade safely and responsibly.
BluetonaFX

免责声明
这些信息和出版物并非旨在提供,也不构成TradingView提供或认可的任何形式的财务、投资、交易或其他类型的建议或推荐。请阅读使用条款了解更多信息。