
A slightly wild variation to this long term bullish theory on Crude Oil 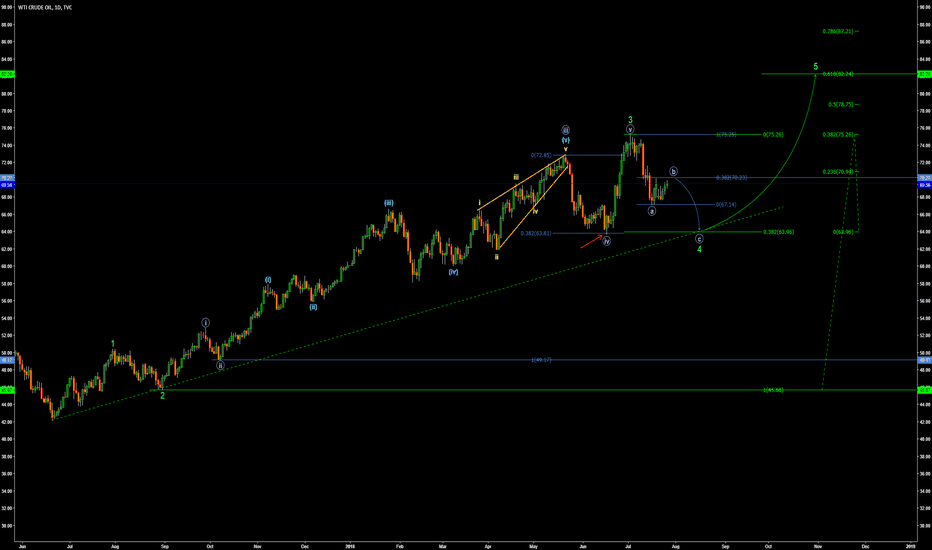
This idea is a bit wild but there are similarities between 2007/08 and 2017/18, explained below in screenshots.
2007/08:
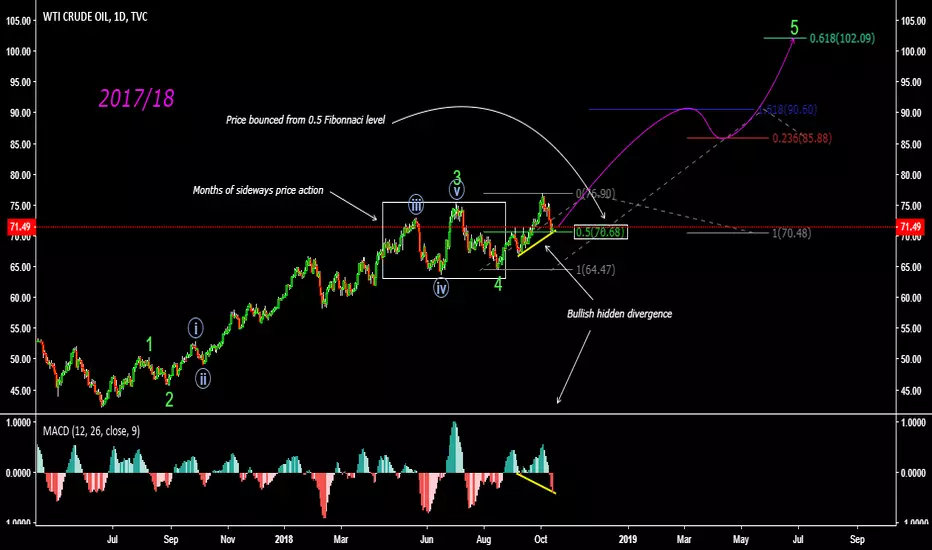
There was 3 months of sideways price action from November 2007 until January 2008, followed by a large rise in price that then corrected to the 0.5 Fibonnaci level. As price fell back there was bullish hidden divergence (MACD histogram made lower low but price made higher low, indicating trend continuation)

2017/18:
Same sideways price action, same large rise following sideways price action, same 0.5 Fibonnaci retracement, same bullish hidden divergence

This idea is a bit wild but there are similarities between 2007/08 and 2017/18, explained below in screenshots.
2007/08:
There was 3 months of sideways price action from November 2007 until January 2008, followed by a large rise in price that then corrected to the 0.5 Fibonnaci level. As price fell back there was bullish hidden divergence (MACD histogram made lower low but price made higher low, indicating trend continuation)
2017/18:
Same sideways price action, same large rise following sideways price action, same 0.5 Fibonnaci retracement, same bullish hidden divergence

免责声明
这些信息和出版物并非旨在提供,也不构成TradingView提供或认可的任何形式的财务、投资、交易或其他类型的建议或推荐。请阅读使用条款了解更多信息。
免责声明
这些信息和出版物并非旨在提供,也不构成TradingView提供或认可的任何形式的财务、投资、交易或其他类型的建议或推荐。请阅读使用条款了解更多信息。