
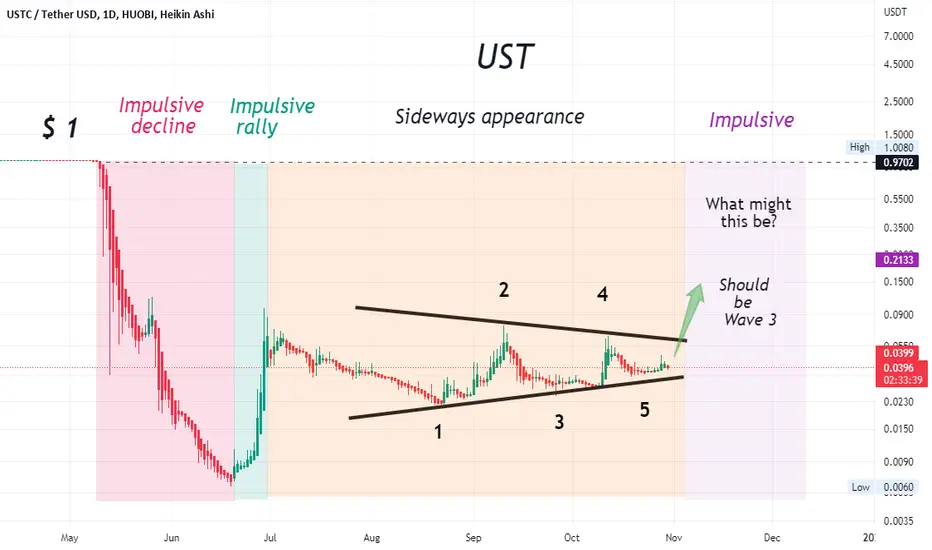
As shown on this chart (consists of three distinct sections),
1-Impulsive decline = supply > demand,
2-Impulsive rally = demand > supply,
3- Sideways appearance = supply and demand are nearly equal.
What to expect next?
At this point, low volatility and low volume indicate a drying up of selling pressure.
Target
Point and Figure Configuration:

1-Impulsive decline = supply > demand,
2-Impulsive rally = demand > supply,
3- Sideways appearance = supply and demand are nearly equal.
What to expect next?
At this point, low volatility and low volume indicate a drying up of selling pressure.
Target
Point and Figure Configuration:
注释
注释
注释
注释
注释
注释
注释

免责声明
这些信息和出版物并非旨在提供,也不构成TradingView提供或认可的任何形式的财务、投资、交易或其他类型的建议或推荐。请阅读使用条款了解更多信息。