
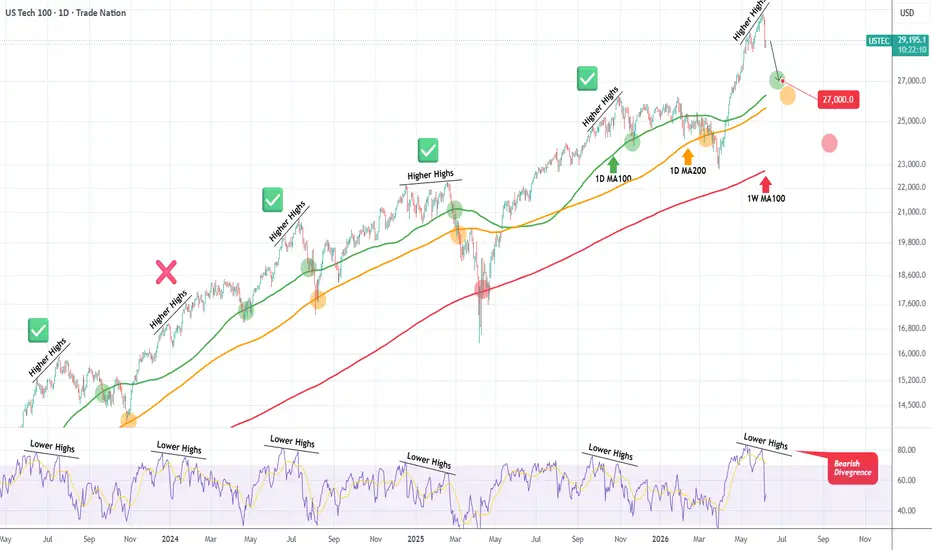
Nasdaq (NDX) had a very aggressive sell-off on Friday as it's 1D RSI got rejected on a Lower Highs trend-line. This huge Bearish Divergence (against the market's actual Higher Highs) has been present and part of the Bull Cycle since 2023, following the bottom of the previous major (Inflation) Bear Cycle.
As you can see on this chart, every time the 1D RSI posted this Lower Highs Bearish Divergence, Nasdaq always kick-started an even bigger correction that eventually hit both its 1D MA100 (green trend-line) and 1D MA200 (orange trend-line) successively. Only the January 2024 Bearish Divergence failed, which however hit the 1D MA100 3 months after eventually. The February 2025 Divergence Sell Signal even hit and aggressively breached the 1W MA100 (red trend-line) but this of course needs a bigger catalyst to drive it besides the technicals, such as the U.S. - China Tariffs War was at the time.
As a result, we expect Nasdaq to hit at least its 1D MA100 - 1D MA200 Zone within 27000 - 26000. If a bearish fundamental catalyst emerges in the process and the market closes a week below its 1D MA200, we may see another bigger correction towards the 1W MA100, which by early estimates could be around 24000 at least.
---
** Please LIKE 👍, FOLLOW ✅, SHARE 🙌 and COMMENT ✍ if you enjoy this idea! Also share your ideas and charts in the comments section below! This is best way to keep it relevant, support us, keep the content here free and allow the idea to reach as many people as possible. **
---
💸💸💸💸💸💸
👇 👇 👇 👇 👇 👇
As you can see on this chart, every time the 1D RSI posted this Lower Highs Bearish Divergence, Nasdaq always kick-started an even bigger correction that eventually hit both its 1D MA100 (green trend-line) and 1D MA200 (orange trend-line) successively. Only the January 2024 Bearish Divergence failed, which however hit the 1D MA100 3 months after eventually. The February 2025 Divergence Sell Signal even hit and aggressively breached the 1W MA100 (red trend-line) but this of course needs a bigger catalyst to drive it besides the technicals, such as the U.S. - China Tariffs War was at the time.
As a result, we expect Nasdaq to hit at least its 1D MA100 - 1D MA200 Zone within 27000 - 26000. If a bearish fundamental catalyst emerges in the process and the market closes a week below its 1D MA200, we may see another bigger correction towards the 1W MA100, which by early estimates could be around 24000 at least.
---
** Please LIKE 👍, FOLLOW ✅, SHARE 🙌 and COMMENT ✍ if you enjoy this idea! Also share your ideas and charts in the comments section below! This is best way to keep it relevant, support us, keep the content here free and allow the idea to reach as many people as possible. **
---
💸💸💸💸💸💸
👇 👇 👇 👇 👇 👇

I trade Crypto, Forex, Indices & Commodities on PrimeXBT — all from one account with TradingView charts 👉 tradingshot.short.gy/PrimeXBT
I also use TradeNation for fixed spreads & zero commission 👉 tradingshot.short.gy/Tradenation
I also use TradeNation for fixed spreads & zero commission 👉 tradingshot.short.gy/Tradenation
免责声明
这些信息和出版物并非旨在提供,也不构成TradingView提供或认可的任何形式的财务、投资、交易或其他类型的建议或推荐。请阅读使用条款了解更多信息。
I trade Crypto, Forex, Indices & Commodities on PrimeXBT — all from one account with TradingView charts 👉 tradingshot.short.gy/PrimeXBT
I also use TradeNation for fixed spreads & zero commission 👉 tradingshot.short.gy/Tradenation
I also use TradeNation for fixed spreads & zero commission 👉 tradingshot.short.gy/Tradenation
免责声明
这些信息和出版物并非旨在提供,也不构成TradingView提供或认可的任何形式的财务、投资、交易或其他类型的建议或推荐。请阅读使用条款了解更多信息。