
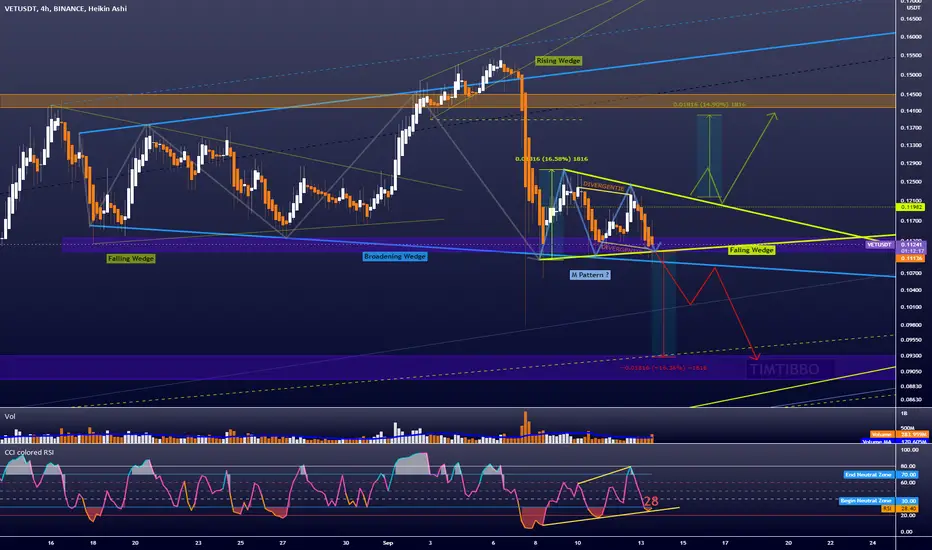
Vechain at the 4 o'clock shows on the bigger picture a Broadening Wedge where the top has already attempted a breakout but the support (formerly resistance) has failed to hold. The Bears were somewhat represented about that and managed to bring the price down quite a bit. Now that an M pattern (bearish) is visible in the possible falling wedge formation, I am extra careful to see if the Bulls can keep the support.
You also see on the RSI that in addition to the hidden bearish divergence on which the price has already fallen, the RSI makes higher bottoms and the price (on the bodies) is falling, which means that there is bullish divergence. The divergence could give the Bulls a chance to move up again and further extra confirm the falling wedge formation, the price must not fall further otherwise divergence is eliminated.
if there is a breakout to the upside on the Falling wedge, the bulls could seek resistance towards $0.14 again.
But if we break through the current support, a further decline towards $0.093 is quite possible.
Keep calm, trade safe and manage your risk.
(Disclaimer: this is not financial advice)
You also see on the RSI that in addition to the hidden bearish divergence on which the price has already fallen, the RSI makes higher bottoms and the price (on the bodies) is falling, which means that there is bullish divergence. The divergence could give the Bulls a chance to move up again and further extra confirm the falling wedge formation, the price must not fall further otherwise divergence is eliminated.
if there is a breakout to the upside on the Falling wedge, the bulls could seek resistance towards $0.14 again.
But if we break through the current support, a further decline towards $0.093 is quite possible.
Keep calm, trade safe and manage your risk.
(Disclaimer: this is not financial advice)

Tims.Technische.Analyse by TIMTIBBO
免责声明
这些信息和出版物并非旨在提供,也不构成TradingView提供或认可的任何形式的财务、投资、交易或其他类型的建议或推荐。请阅读使用条款了解更多信息。
Tims.Technische.Analyse by TIMTIBBO
免责声明
这些信息和出版物并非旨在提供,也不构成TradingView提供或认可的任何形式的财务、投资、交易或其他类型的建议或推荐。请阅读使用条款了解更多信息。