
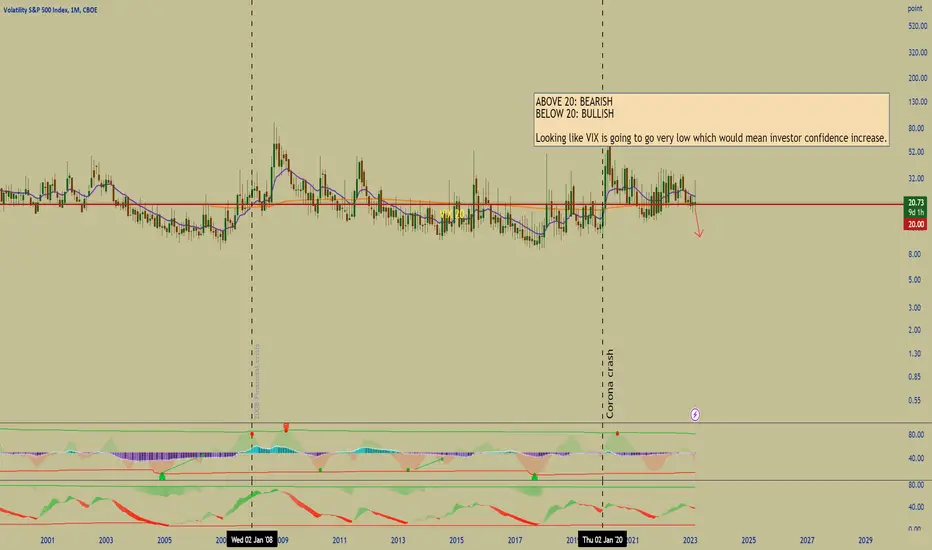
VIX showing signals of a bullish market open
1)I believe something will big will happen to the market in the upcoming days as the VIX is almost reaching a new All time Low possibly indicating a bullish shift in the market.
2) In the second chart shown, it seems like the VIX will enter a free fall.
How to translate the VIX: Above 20 we are bearish and below 20 we are bullish. The VIX indicator is a representation of investor fear in the market. As the fear grows, the number increases making it bad for the market overall.
Why should we care?
-This indicator has successfully predicted the 2008 crash and Corona crash. It is a very powerful indicator when it comes to knowing how investors feel psychologically about the market.
1)I believe something will big will happen to the market in the upcoming days as the VIX is almost reaching a new All time Low possibly indicating a bullish shift in the market.
2) In the second chart shown, it seems like the VIX will enter a free fall.
How to translate the VIX: Above 20 we are bearish and below 20 we are bullish. The VIX indicator is a representation of investor fear in the market. As the fear grows, the number increases making it bad for the market overall.
Why should we care?
-This indicator has successfully predicted the 2008 crash and Corona crash. It is a very powerful indicator when it comes to knowing how investors feel psychologically about the market.

免责声明
这些信息和出版物并非旨在提供,也不构成TradingView提供或认可的任何形式的财务、投资、交易或其他类型的建议或推荐。请阅读使用条款了解更多信息。
免责声明
这些信息和出版物并非旨在提供,也不构成TradingView提供或认可的任何形式的财务、投资、交易或其他类型的建议或推荐。请阅读使用条款了解更多信息。