
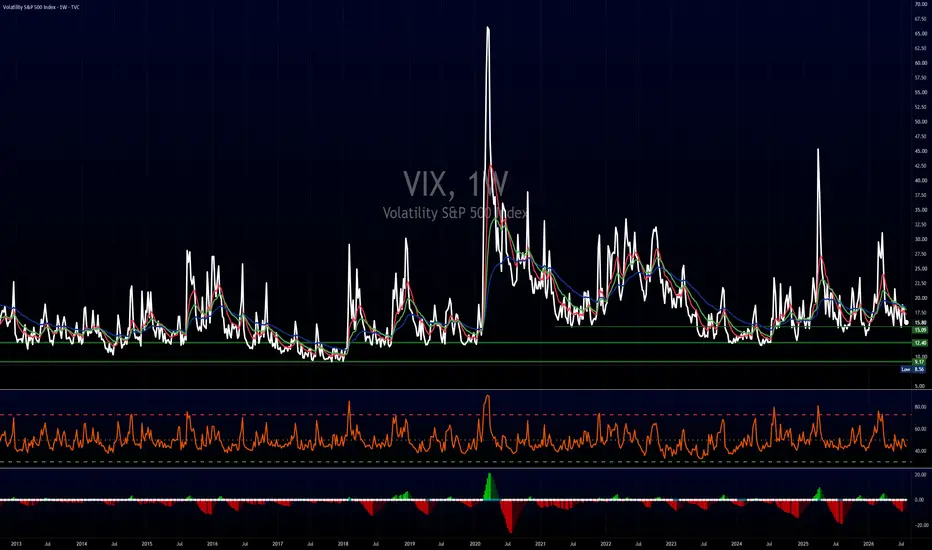
Zooming out to the weekly chart gives us a much clearer view of the macro picture without all the daily noise.
The Multi Year Floor
The weekly chart makes the long term picture easier to understand. The VIX has a clear floor that shows up again and again. Most of the time it stops falling in the same zone between thirteen and fifteen. Every time it reaches this area it bounces or moves sideways. This tells us the market is calm but not careless. Traders still want some protection and that keeps the VIX from breaking down.
Enter the TACO Trade
So why does fear stay so suppressed? A huge driver in this market is the TACO trade dynamic: "Trump Always Chickens Out" (or more broadly, the expectation that tariff, war, and policy threats will eventually be walked back or negotiated down).
This is the kind of environment where the market slowly grinds higher. The weekly chart supports that idea. The VIX is resting on strong long term support. There is no sign of panic. There is no sign of a major shift in trend. Even with global tension and political noise the market has stayed steady. That is what the TACO trade looks like. Calm, steady, and driven by strong tech leadership.
The Big Takeaway
As long as the market believes maximum downside threats won't fully materialize, volatility will likely bounce around this 15 area while stocks grind upward. Just remember: when everyone gets too comfortable expecting the walk-back, a real unexpected shock can trigger a very sharp move back toward 20 or higher.
The Multi Year Floor
The weekly chart makes the long term picture easier to understand. The VIX has a clear floor that shows up again and again. Most of the time it stops falling in the same zone between thirteen and fifteen. Every time it reaches this area it bounces or moves sideways. This tells us the market is calm but not careless. Traders still want some protection and that keeps the VIX from breaking down.
Enter the TACO Trade
So why does fear stay so suppressed? A huge driver in this market is the TACO trade dynamic: "Trump Always Chickens Out" (or more broadly, the expectation that tariff, war, and policy threats will eventually be walked back or negotiated down).
This is the kind of environment where the market slowly grinds higher. The weekly chart supports that idea. The VIX is resting on strong long term support. There is no sign of panic. There is no sign of a major shift in trend. Even with global tension and political noise the market has stayed steady. That is what the TACO trade looks like. Calm, steady, and driven by strong tech leadership.
The Big Takeaway
As long as the market believes maximum downside threats won't fully materialize, volatility will likely bounce around this 15 area while stocks grind upward. Just remember: when everyone gets too comfortable expecting the walk-back, a real unexpected shock can trigger a very sharp move back toward 20 or higher.

免责声明
这些信息和出版物并非旨在提供,也不构成TradingView提供或认可的任何形式的财务、投资、交易或其他类型的建议或推荐。请阅读使用条款了解更多信息。