
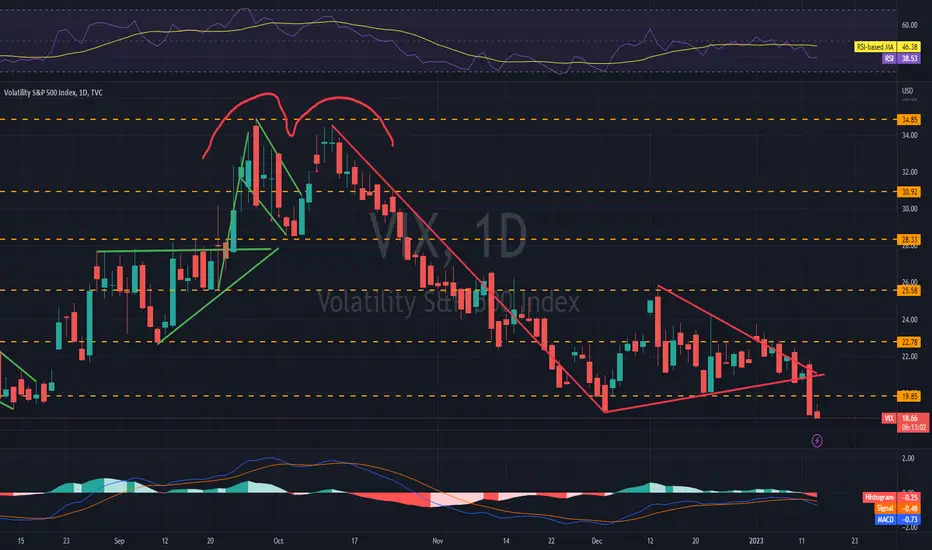
VIX Daily represented in a Symetrical Triangle coming into the pattern from a bearish stance. This generally signifies a continuation pattern as it has on this chart. Its odd to see the VIX dropping while the SPX is also dropping today. Lets see if that holds. We may get BTD going on and the VIX may retest the pattern as it should.

免责声明
这些信息和出版物并非旨在提供,也不构成TradingView提供或认可的任何形式的财务、投资、交易或其他类型的建议或推荐。请阅读使用条款了解更多信息。
免责声明
这些信息和出版物并非旨在提供,也不构成TradingView提供或认可的任何形式的财务、投资、交易或其他类型的建议或推荐。请阅读使用条款了解更多信息。