
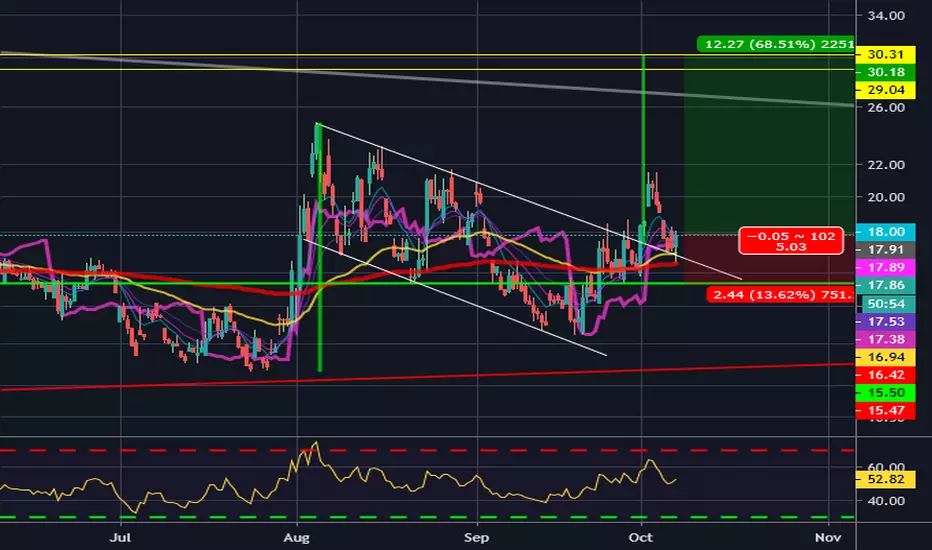
The green, vertical bar is the bullflag pole length as the top yellow line, while the bottom yellow line is the 1.386 fib retracement from the correction down within the bullflag, which combined gives us a projected upside zone between the two yellow lines.
The fact that none of the trade war meetings have resulted in anything tangible and traders nervousness about it, I think this flag could hold.
BUT, if we start breaking back down into the flag and make a lower low, it could lead back down to the bottom of the flag. I find this unlikely, but it is always a possibility.

免责声明
这些信息和出版物并非旨在提供,也不构成TradingView提供或认可的任何形式的财务、投资、交易或其他类型的建议或推荐。请阅读使用条款了解更多信息。
免责声明
这些信息和出版物并非旨在提供,也不构成TradingView提供或认可的任何形式的财务、投资、交易或其他类型的建议或推荐。请阅读使用条款了解更多信息。