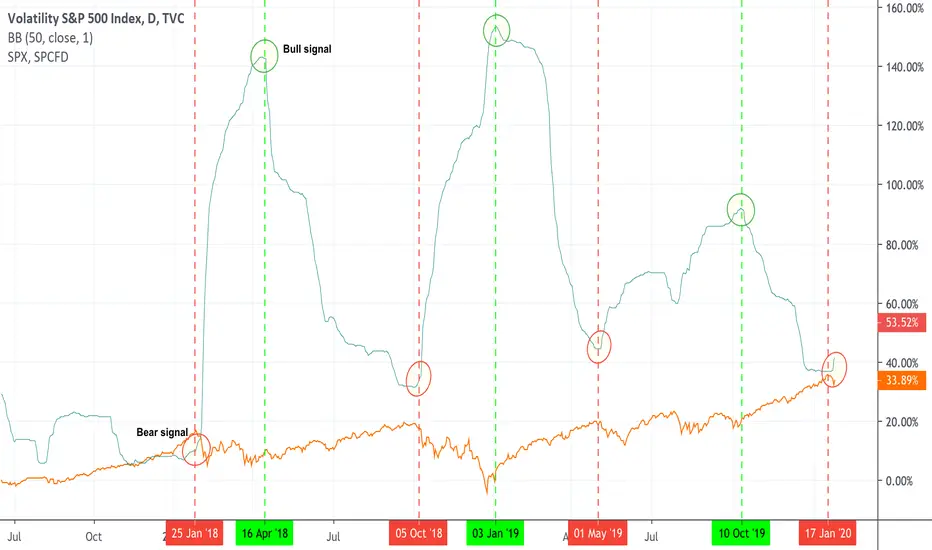
I follow a CFA from Charles Schwab, who uses this signal to establish negative or positive sentiment. To notice how it worked in the past, I have added the S&P500 trend line.
The idea is as follows:
When the upper Bollinger Band (with a 50 period and 1 standard deviation) on the VIX turns higher, that is a bearish sign, and when it turns lower, the SPY tends to rally.
-----------
Also, today January 28th, we had a Hindenburg Omen flash.
The idea is as follows:
When the upper Bollinger Band (with a 50 period and 1 standard deviation) on the
VIX turns higher, that is a bearish sign, and when it turns lower, the SPY tends to rally.-----------
Also, today January 28th, we had a Hindenburg Omen flash.

免责声明
这些信息和出版物并非旨在提供,也不构成TradingView提供或认可的任何形式的财务、投资、交易或其他类型的建议或推荐。请阅读使用条款了解更多信息。
免责声明
这些信息和出版物并非旨在提供,也不构成TradingView提供或认可的任何形式的财务、投资、交易或其他类型的建议或推荐。请阅读使用条款了解更多信息。