
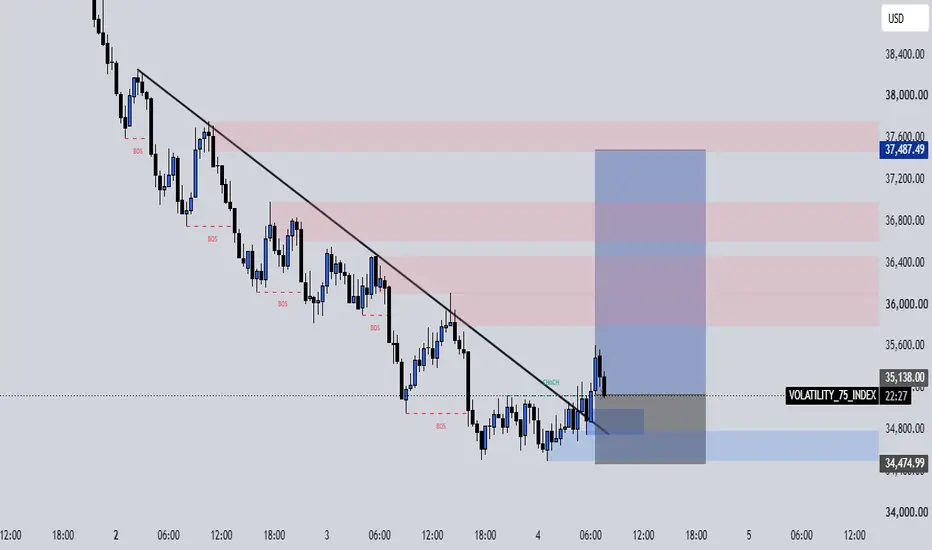
VOLATILITY 75 INDEX – BUY Analysis
1. Market Structure: The market was previously in a downtrend, forming Lower Highs and Lower Lows.
2. BOS (Break of Structure): Red BOS labels show where price broke previous support levels, confirming bearish momentum.
3. Trendline: The black descending trendline shows the previous bearish direction. Price later broke above it.
4. Supply Zones: Red areas represent potential selling zones where price may face resistance.
5. Demand Zone: The blue area represents a potential buying zone where buyers may enter.
6. CHoCH: The green CHoCH indicates a possible change from bearish to bullish market structure.
7. BUY Setup:
Entry: 35,138.00
Take Profit: 37,487.49
Stop Loss: 34,474.99
Conclusion: Price is showing signs of a bullish reversal after reacting to the demand zone and breaking the descending trendline. A BUY opportunity is possible, but always wait for confirmation and manage your risk.
1. Market Structure: The market was previously in a downtrend, forming Lower Highs and Lower Lows.
2. BOS (Break of Structure): Red BOS labels show where price broke previous support levels, confirming bearish momentum.
3. Trendline: The black descending trendline shows the previous bearish direction. Price later broke above it.
4. Supply Zones: Red areas represent potential selling zones where price may face resistance.
5. Demand Zone: The blue area represents a potential buying zone where buyers may enter.
6. CHoCH: The green CHoCH indicates a possible change from bearish to bullish market structure.
7. BUY Setup:
Entry: 35,138.00
Take Profit: 37,487.49
Stop Loss: 34,474.99
Conclusion: Price is showing signs of a bullish reversal after reacting to the demand zone and breaking the descending trendline. A BUY opportunity is possible, but always wait for confirmation and manage your risk.

免责声明
这些信息和出版物并非旨在提供,也不构成TradingView提供或认可的任何形式的财务、投资、交易或其他类型的建议或推荐。请阅读使用条款了解更多信息。