
📊 The S&P 500 is down approximately 5% year-to-date. The Iran war drove Brent crude past $120 per barrel, spooked the Fed into holding rates, pushed the Dow to fresh 2026 lows, and triggered a rotation out of growth stocks and into defensives.
VOO, which tracks every single one of those 500 companies, is sitting at a weekly demand zone with two clean entries mapped.
History is unambiguous on this. The S&P 500 has delivered a compound annual return of 10.6% since its inception in 1957. Every major geopolitical shock in that period, wars, oil embargoes, financial crises, pandemics, produced a buying opportunity for patient investors.
The Iran war is not different. It is creating the discount.
The fundamental case for owning America's index does not change because of a conflict in the Middle East.
VOO holds 500 of the most profitable, well-capitalised companies on earth. AUM stands at $830.39 billion. Dividend yield is approximately 1.17%. Expense ratio is 0.03%. The TipRanks analyst consensus across all holdings is Moderate Buy with an implied average price target upside of approximately 27%.
The S&P 500 closed its worst week of 2026 at 6,506. Peace talks between the US and Iran are now reportedly underway with Trump ordering a five-day pause on strikes. If diplomatic momentum holds, the oil price relief will flow directly back into the growth stocks that drive VOO's performance.
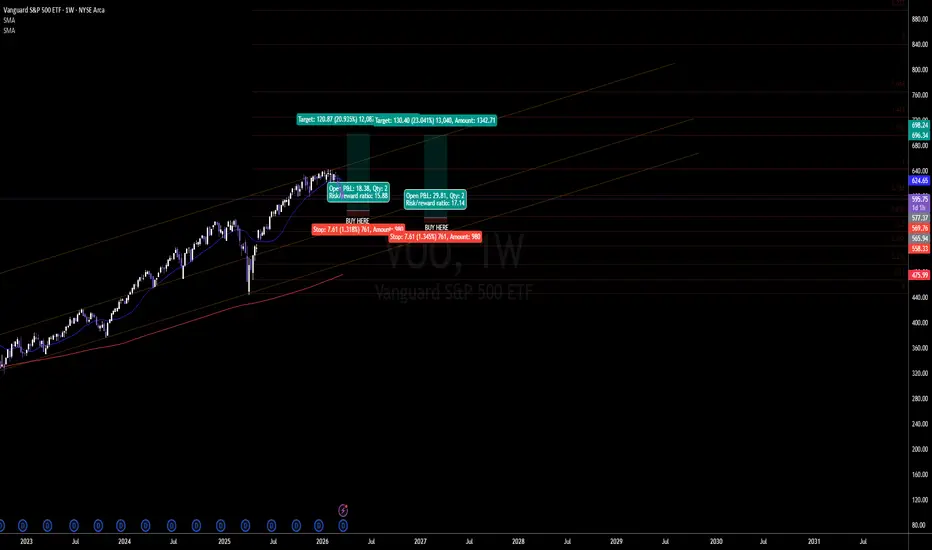
The weekly chart shows price has pulled back cleanly from the $698.24 highs into two Fibonacci demand zones. The long-term uptrend channel from 2023 remains firmly intact. The red SMA 200 is curling upward as structural support beneath both buy zones.
🟢 Buy Zone 1 ($577.35 area)
First weekly demand zone and the 0.382 Fibonacci retracement of the 2024 to 2026 bull run.
Stop: $569.76 (1.318% below entry) / $980 position
Qty: 2
Risk/Reward Ratio: 15.68
Target: $698.24 (+20.935% / $1,342.71)
🟢 Buy Zone 2 ($565.94 area)
Deeper weekly demand zone at the 0.5 Fibonacci level and prior breakout shelf.
Stop: $558.33 (1.345% below entry) / $980 position
Qty: 2
Risk/Reward Ratio: 17.14
Target: $696.34 (+23.041% / $1,342.71)
Key Levels:
🔑 Current Price: $596.00
🔑 Buy Zone 1: $577.35
🔑 Stop Zone 1: $569.76
🔑 Buy Zone 2: $565.94
🔑 Stop Zone 2: $558.33
🔑 52-Week High: $698.24
🔑 AUM: $830.39B
🔑 Dividend Yield: ~1.17%
🔑 Expense Ratio: 0.03%
🔑 S&P 500 YTD: approximately -5%
🔑 S&P 500 Annual Average Since 1957: 10.6%
🎯 Target 1: $698.24 (+20.935% / $1,342.71)
🎯 Target 2: $696.34 (+23.041% / $1,342.71)
⚠️ Hard Stop Zone 1: $569.76
⚠️ Hard Stop Zone 2: $558.33
The war created the discount. History says buy it. Two weekly buy zones mapped.
VOO, which tracks every single one of those 500 companies, is sitting at a weekly demand zone with two clean entries mapped.
History is unambiguous on this. The S&P 500 has delivered a compound annual return of 10.6% since its inception in 1957. Every major geopolitical shock in that period, wars, oil embargoes, financial crises, pandemics, produced a buying opportunity for patient investors.
The Iran war is not different. It is creating the discount.
The fundamental case for owning America's index does not change because of a conflict in the Middle East.
VOO holds 500 of the most profitable, well-capitalised companies on earth. AUM stands at $830.39 billion. Dividend yield is approximately 1.17%. Expense ratio is 0.03%. The TipRanks analyst consensus across all holdings is Moderate Buy with an implied average price target upside of approximately 27%.
The S&P 500 closed its worst week of 2026 at 6,506. Peace talks between the US and Iran are now reportedly underway with Trump ordering a five-day pause on strikes. If diplomatic momentum holds, the oil price relief will flow directly back into the growth stocks that drive VOO's performance.
The weekly chart shows price has pulled back cleanly from the $698.24 highs into two Fibonacci demand zones. The long-term uptrend channel from 2023 remains firmly intact. The red SMA 200 is curling upward as structural support beneath both buy zones.
🟢 Buy Zone 1 ($577.35 area)
First weekly demand zone and the 0.382 Fibonacci retracement of the 2024 to 2026 bull run.
Stop: $569.76 (1.318% below entry) / $980 position
Qty: 2
Risk/Reward Ratio: 15.68
Target: $698.24 (+20.935% / $1,342.71)
🟢 Buy Zone 2 ($565.94 area)
Deeper weekly demand zone at the 0.5 Fibonacci level and prior breakout shelf.
Stop: $558.33 (1.345% below entry) / $980 position
Qty: 2
Risk/Reward Ratio: 17.14
Target: $696.34 (+23.041% / $1,342.71)
Key Levels:
🔑 Current Price: $596.00
🔑 Buy Zone 1: $577.35
🔑 Stop Zone 1: $569.76
🔑 Buy Zone 2: $565.94
🔑 Stop Zone 2: $558.33
🔑 52-Week High: $698.24
🔑 AUM: $830.39B
🔑 Dividend Yield: ~1.17%
🔑 Expense Ratio: 0.03%
🔑 S&P 500 YTD: approximately -5%
🔑 S&P 500 Annual Average Since 1957: 10.6%
🎯 Target 1: $698.24 (+20.935% / $1,342.71)
🎯 Target 2: $696.34 (+23.041% / $1,342.71)
⚠️ Hard Stop Zone 1: $569.76
⚠️ Hard Stop Zone 2: $558.33
The war created the discount. History says buy it. Two weekly buy zones mapped.

免责声明
这些信息和出版物并非旨在提供,也不构成TradingView提供或认可的任何形式的财务、投资、交易或其他类型的建议或推荐。请阅读使用条款了解更多信息。
免责声明
这些信息和出版物并非旨在提供,也不构成TradingView提供或认可的任何形式的财务、投资、交易或其他类型的建议或推荐。请阅读使用条款了解更多信息。