
Long-term buying opportunity for valuable and growth stock VPB
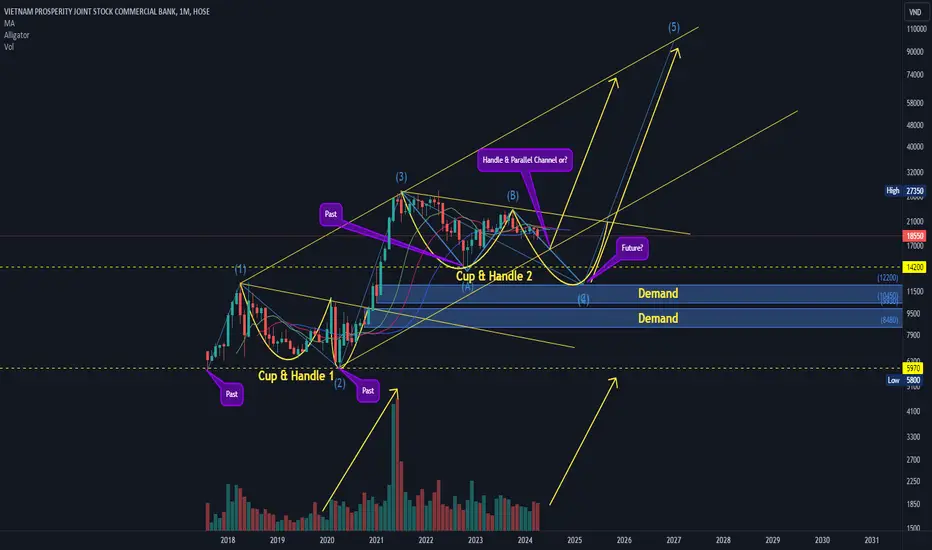
By examining the monthly chart of VPB stock, we can observe a pattern resembling a "cup and handle" formation, albeit with a significant downward movement prior to this pattern. This deviation from the textbook "cup and handle" could potentially classify it as a "double bottom" formation. However, considering the market's turmoil during the COVID-19 pandemic, the widespread sell-off, and VPB's relatively recent IPO, investor confidence might have been initially low. Nevertheless, a remarkable recovery ensued, culminating in a textbook Elliott wave 3 surge.
Currently, the stock appears to be in the "handle" phase of the cup and handle formation. Based on the two previous peaks, a parallel price channel can be drawn, suggesting that the bottom of the ABC corrective wave could lie around the "Handle & Parallel Channel" zone marked at 16.6k.
Alternatively, following the principles of supply and demand, the bottom of wave 4 or the conclusion of wave ABC could reside within the highlighted demand zone around 12.2k. This zone also coincides with a previous break below the "cup" level, which subsequently formed a second "double bottom" pattern and continued its upward trend with a bullish flag formation.
As market participants, we should closely monitor the price action around these support zones and await clear signals before entering the market.
Currently, the stock appears to be in the "handle" phase of the cup and handle formation. Based on the two previous peaks, a parallel price channel can be drawn, suggesting that the bottom of the ABC corrective wave could lie around the "Handle & Parallel Channel" zone marked at 16.6k.
Alternatively, following the principles of supply and demand, the bottom of wave 4 or the conclusion of wave ABC could reside within the highlighted demand zone around 12.2k. This zone also coincides with a previous break below the "cup" level, which subsequently formed a second "double bottom" pattern and continued its upward trend with a bullish flag formation.
As market participants, we should closely monitor the price action around these support zones and await clear signals before entering the market.

免责声明
这些信息和出版物并非旨在提供,也不构成TradingView提供或认可的任何形式的财务、投资、交易或其他类型的建议或推荐。请阅读使用条款了解更多信息。
免责声明
这些信息和出版物并非旨在提供,也不构成TradingView提供或认可的任何形式的财务、投资、交易或其他类型的建议或推荐。请阅读使用条款了解更多信息。