
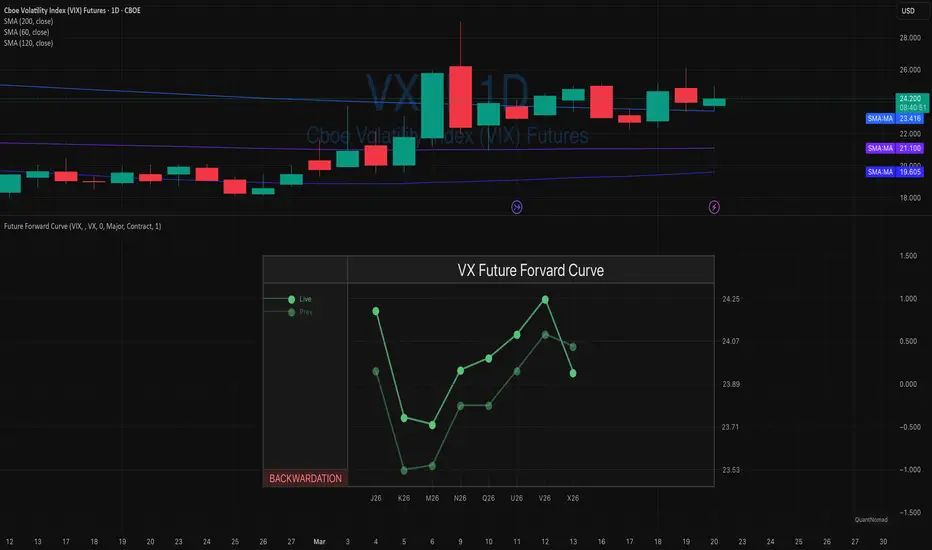
The VIX futures curve is currently extremely flat, with curve compression at ~0.55 today (vs ~0.60 yesterday) — meaning only about a $0.55 difference between the lowest and highest futures.
What makes this interesting is that it’s not easy to visually spot on a chart, but in reality, this is an unusually compressed structure for the VIX forward curve.
Such conditions are very rare, occurring in <2% of cases (~90 days since 2004).
A flat curve reflects uncertainty across maturities, where the market is pricing similar volatility regardless of time horizon.
Historically, these regimes tend not to persist and often resolve with volatility expansion.
Past examples include:
• November 2007
• October & December 2018
• March / April 2025
➡️ Not a standalone signal, but a condition to monitor
➡️ Suggests asymmetric risk toward higher volatility
Disclaimer:
This analysis is for educational purposes only and reflects personal market observations. It does not constitute investment, financial, or trading advice. Always conduct your own research before making trading decisions.
What makes this interesting is that it’s not easy to visually spot on a chart, but in reality, this is an unusually compressed structure for the VIX forward curve.
Such conditions are very rare, occurring in <2% of cases (~90 days since 2004).
A flat curve reflects uncertainty across maturities, where the market is pricing similar volatility regardless of time horizon.
Historically, these regimes tend not to persist and often resolve with volatility expansion.
Past examples include:
• November 2007
• October & December 2018
• March / April 2025
➡️ Not a standalone signal, but a condition to monitor
➡️ Suggests asymmetric risk toward higher volatility
Disclaimer:
This analysis is for educational purposes only and reflects personal market observations. It does not constitute investment, financial, or trading advice. Always conduct your own research before making trading decisions.

Quant Developer | Pine Script v6 | Python & R
12+ yrs system. trading, hedge fund experience
Indicators, strategies & screeners
Futures & options
💼 Hire/Consulting:
qntly.com/hire
🎓 Pine Code With AI:
qntly.com/pineai
12+ yrs system. trading, hedge fund experience
Indicators, strategies & screeners
Futures & options
💼 Hire/Consulting:
qntly.com/hire
🎓 Pine Code With AI:
qntly.com/pineai
免责声明
这些信息和出版物并非旨在提供,也不构成TradingView提供或认可的任何形式的财务、投资、交易或其他类型的建议或推荐。请阅读使用条款了解更多信息。
Quant Developer | Pine Script v6 | Python & R
12+ yrs system. trading, hedge fund experience
Indicators, strategies & screeners
Futures & options
💼 Hire/Consulting:
qntly.com/hire
🎓 Pine Code With AI:
qntly.com/pineai
12+ yrs system. trading, hedge fund experience
Indicators, strategies & screeners
Futures & options
💼 Hire/Consulting:
qntly.com/hire
🎓 Pine Code With AI:
qntly.com/pineai
免责声明
这些信息和出版物并非旨在提供,也不构成TradingView提供或认可的任何形式的财务、投资、交易或其他类型的建议或推荐。请阅读使用条款了解更多信息。