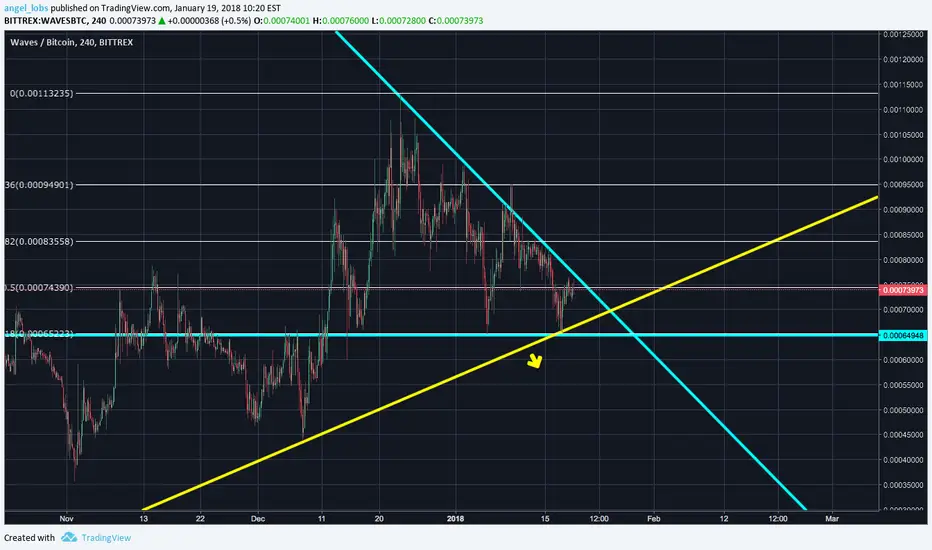
WAVESBTC is inside a "huge" symmetrical but we can see a strong support at the 0.618 Fib level, it got support there 3 times, making a triple bottom.
Because of that support we see a (Bull) Descending Triangle forming, normally this pattern indicates a drop in price (continuation of the fall) but since WAVESBTC made that triple bottom it should have "power" to break the "downtrend" line, thus meaning it could rise in price.
Careful if it drops bellow the Yellow support!
Its possible that it does another bounce then it "explodes" or one way or the other so wait for a breakout confirmation to start your positions!
Trade safe!
注释
Wait for a confirmation on either sides! This is a Neutral trade!注释
Careful, a BIG Head & Shoulders formed, that plus a Descending triangle, could be bad news for the Support line!
As I said this is a Neutral trade!
Wait for a confirmation of a breakout on either sides!
Trade Safe!
注释
Ichimoku at 1D shows bearish.. Price is struggling to get inside the cloud.
Tenkan < Kijun...
You could start a Short Trade with a Stop Loss a bit up of the top of the triangle in case it fools us all and breaks upwards.
交易开始
You could start a Short Trade with a Stop Loss a bit up of the top of the triangle in case it fools us all and breaks upwards.注释
Tried to breakout upwards but it failed, it had a High of 81.2k sats but it closed on 74.5k sats.
We are bouncing downwards now.
注释
On 4H TF kijun is at 74k sats, price should not close bellow the kijun. (for long trades)
注释
Did 2 false breakouts already!
As you can see after the second false breakout the price got dumped really hard! Glady (for long trades) it found support inside the Ichimoku cloud at 2H
注释
Even on the 2H chart as you can see Tenkan < Kijun so that shows bearish, lets see if the candle closes above the Cloud...交易手动结束
Sorry to inform but this Idea will be closed so I can turn my attention to BTCUSD.Trade safe!

免责声明
这些信息和出版物并非旨在提供,也不构成TradingView提供或认可的任何形式的财务、投资、交易或其他类型的建议或推荐。请阅读使用条款了解更多信息。
免责声明
这些信息和出版物并非旨在提供,也不构成TradingView提供或认可的任何形式的财务、投资、交易或其他类型的建议或推荐。请阅读使用条款了解更多信息。