做空
WAVESUSD: BUY Zone
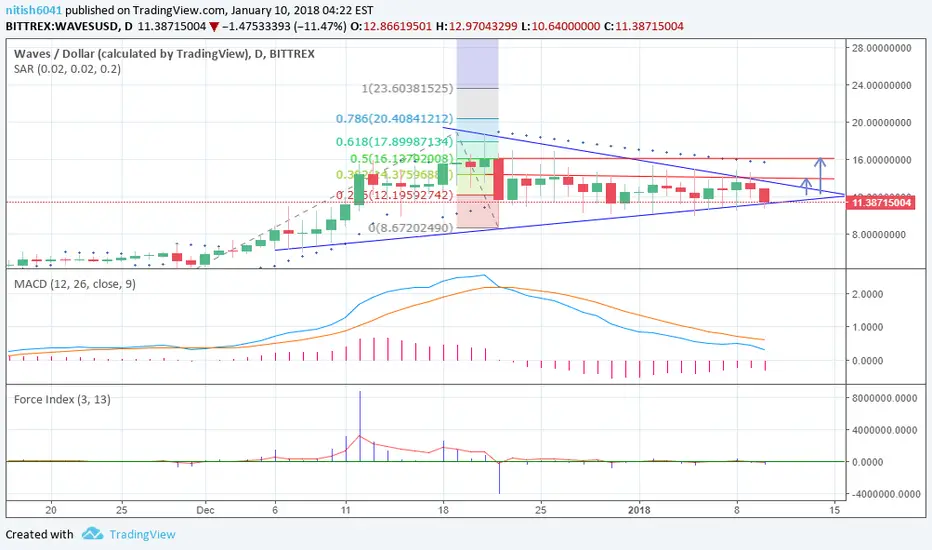
WAVES should continue to oscillate in the triangle for next few days and move sideways as supported by no volume in Force Index, bearish SAR and MACD.
Even if it breaks out of the triangle, it will meet strong resistance at 38.2 FIB, once it breaks that it face significant resistance at 50 FIB. Chances of reversal from these two levels seem to be good.
But a successful breakout above these two levels can make WAVES to a price of 18-23.6 $. Other technical indicators should support in order for this breakout to happen which I do not see as of now.
Currently WAVES is in a BUY opportunity zone.
Disclaimer: This chart is just for informational purposes and not an investment advice. Please trade at your own risk.
Even if it breaks out of the triangle, it will meet strong resistance at 38.2 FIB, once it breaks that it face significant resistance at 50 FIB. Chances of reversal from these two levels seem to be good.
But a successful breakout above these two levels can make WAVES to a price of 18-23.6 $. Other technical indicators should support in order for this breakout to happen which I do not see as of now.
Currently WAVES is in a BUY opportunity zone.
Disclaimer: This chart is just for informational purposes and not an investment advice. Please trade at your own risk.

免责声明
这些信息和出版物并非旨在提供,也不构成TradingView提供或认可的任何形式的财务、投资、交易或其他类型的建议或推荐。请阅读使用条款了解更多信息。
免责声明
这些信息和出版物并非旨在提供,也不构成TradingView提供或认可的任何形式的财务、投资、交易或其他类型的建议或推荐。请阅读使用条款了解更多信息。