做多
WAVES Bullish Flag (Potentially 40% UP)
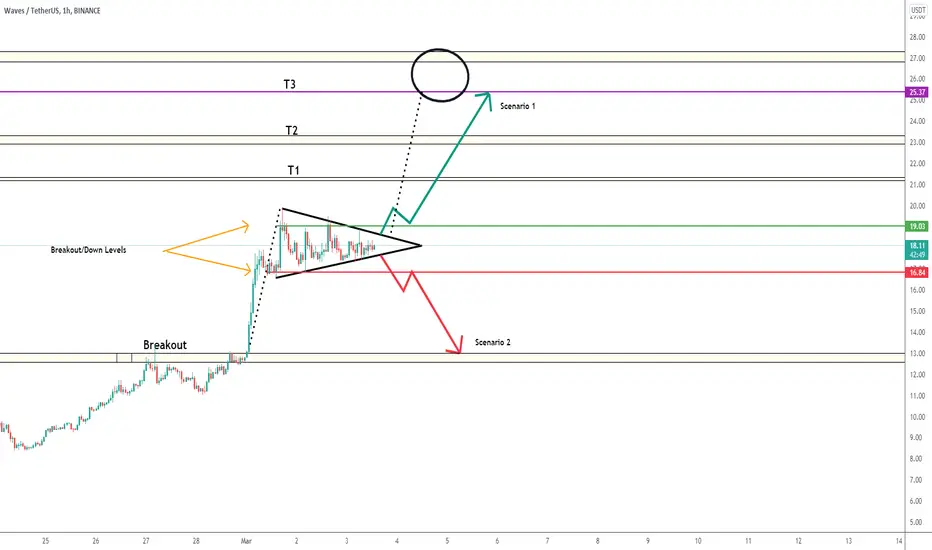
Waves broke the resistance at roughly 13 dollars, and now its forming a bull flag.
Scenario 1 - If WAVES managed to break above the resistance line as highlighted, then and on the balance of probabilities, it is expected that wave will reach the targets illustrated on the chart
Scenario 2 - If waves failed to maintain the support and broke below, I don't see any support to hold it all the way back to the breakout point at roughly 13 dollars
Scenario 1 - If WAVES managed to break above the resistance line as highlighted, then and on the balance of probabilities, it is expected that wave will reach the targets illustrated on the chart
Scenario 2 - If waves failed to maintain the support and broke below, I don't see any support to hold it all the way back to the breakout point at roughly 13 dollars
注释
WAVES broke above the breakout level on the hourly注释
Scenario 1 achieved the first target but currently it has been invalidated Will keep you updated on the Scenario 2 as it is currently reaching the breakdown level
注释
Although the move didn't play exactly as described, as we all know TA is subjective, hence, looking back at the chart, I believe that WAVES was running defined between the two breakout ranges (rather than triangle formation)at the time of posting 2 targets achieved
交易结束:到达目标
All Targets achieved
免责声明
这些信息和出版物并非旨在提供,也不构成TradingView提供或认可的任何形式的财务、投资、交易或其他类型的建议或推荐。请阅读使用条款了解更多信息。
免责声明
这些信息和出版物并非旨在提供,也不构成TradingView提供或认可的任何形式的财务、投资、交易或其他类型的建议或推荐。请阅读使用条款了解更多信息。