
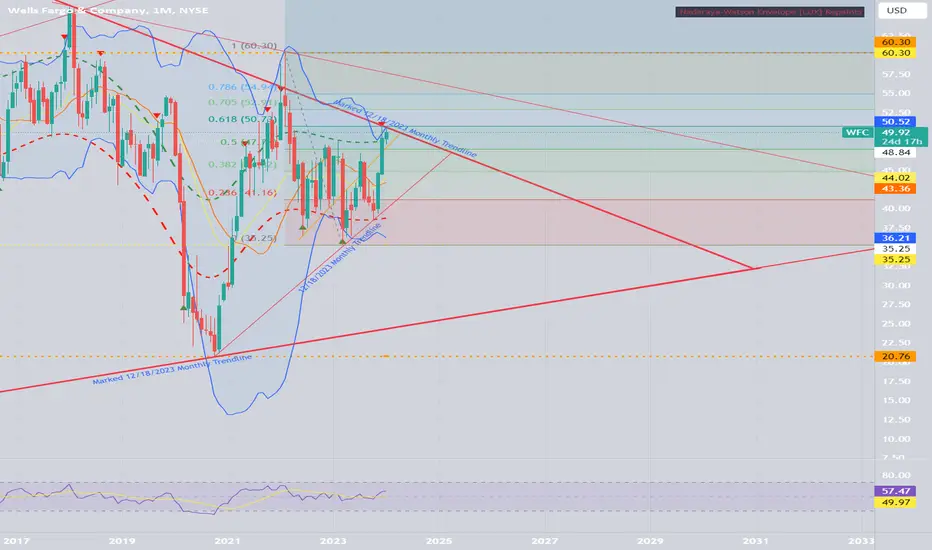
On the monthly chart for WFC, the upper trend line has been respected multiple times(including Jan and Feb 2022) so far. Look at the red trendline(Marked 12/18/2023 Monthly Trendline) and the Fib 61.8 rejection(perfect to the cent) in December 2023. Look at the orange colored trendline(12/18/2023 Monthly Trendline) that has been respected since Dec 2020.
On a weekly basis, rejected the Marked 12/18/2023 Monthly Trendline, Fib 61.8 rejection, upper Bollinger band, strong support at 47.04, double top. However, there is divergence between RSI and price action, where, RSI is going up, while price is heading down. VIX is also very low. Dollar down.
Earnings on 1/12/2024.
On a weekly basis, rejected the Marked 12/18/2023 Monthly Trendline, Fib 61.8 rejection, upper Bollinger band, strong support at 47.04, double top. However, there is divergence between RSI and price action, where, RSI is going up, while price is heading down. VIX is also very low. Dollar down.
Earnings on 1/12/2024.

免责声明
这些信息和出版物并非旨在提供,也不构成TradingView提供或认可的任何形式的财务、投资、交易或其他类型的建议或推荐。请阅读使用条款了解更多信息。