Walmart Stock Analysis: Longer time frame is Key
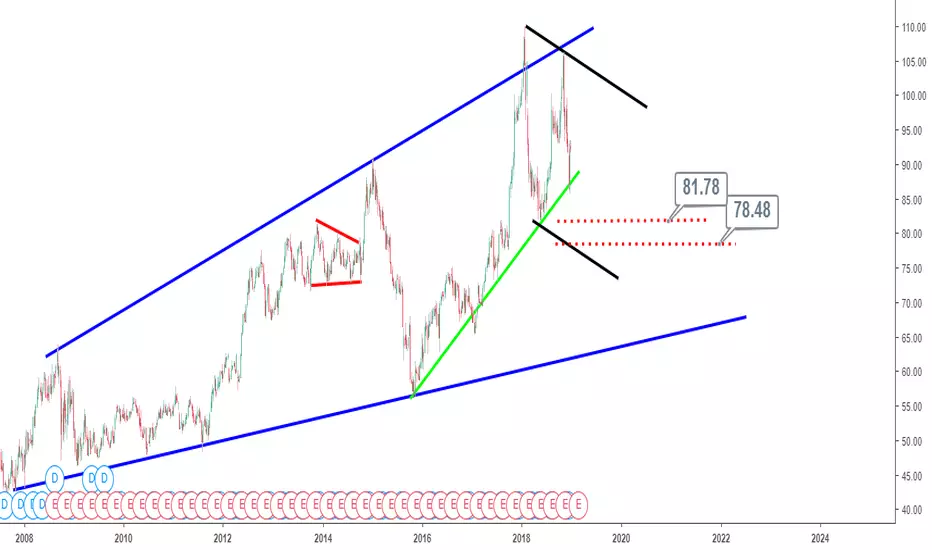
Coin Analyst Investments is kicking of the new year by looking at a long term chart of Walmart (WMT). Over a decade of price action is presented in today’s Walmart Stock analysis with emphasis placed on the bullish price swing from November 16, 2015 starting from a price low of ~$56.36.
The current move upwards from November 16, 2015 is highlighted with the use of a bullish trendline (in green) which is expected to keep offering support for any bullish position(s). However, a break below the trendline could see the price of Walmart retrace back to between 81.78 and 78.48 where another support is anticipated.
Also shown on the Weekly timeframe chart is a bearish channel (tentative) that should also be considered as part of monitoring the progression of Walmart for weeks or months to follow. A break below the lower level of support (i.e. $71.48) could see prices reach the bottom of the bearish channel. Momentum is highly important in confirming which directions warrant any trade(s).
The current move upwards from November 16, 2015 is highlighted with the use of a bullish trendline (in green) which is expected to keep offering support for any bullish position(s). However, a break below the trendline could see the price of Walmart retrace back to between 81.78 and 78.48 where another support is anticipated.
Also shown on the Weekly timeframe chart is a bearish channel (tentative) that should also be considered as part of monitoring the progression of Walmart for weeks or months to follow. A break below the lower level of support (i.e. $71.48) could see prices reach the bottom of the bearish channel. Momentum is highly important in confirming which directions warrant any trade(s).

免责声明
这些信息和出版物并非旨在提供,也不构成TradingView提供或认可的任何形式的财务、投资、交易或其他类型的建议或推荐。请阅读使用条款了解更多信息。