做多
Flying trade.
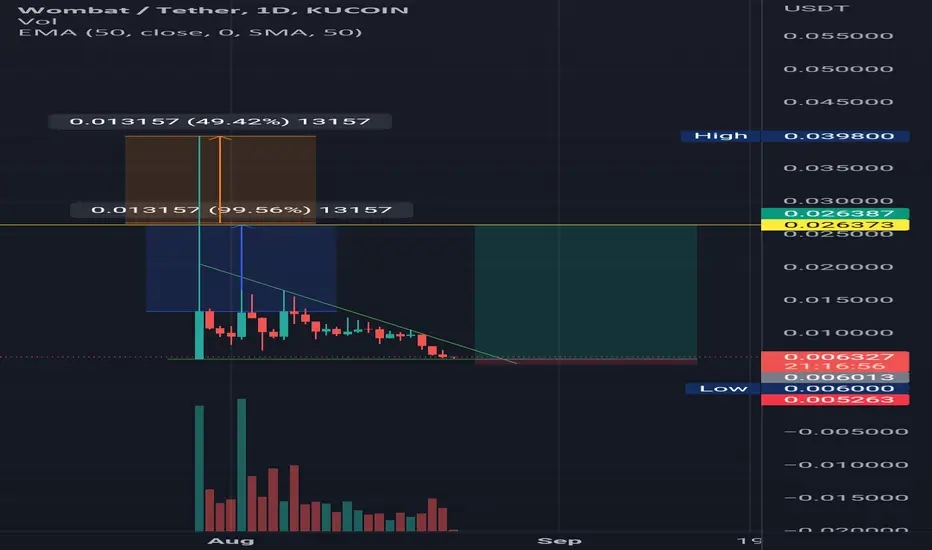
From this analysis, we could see the support level rejecting the current candle from breaking down. A trend line across the price previous wick which makes it form a triangle of a end point to the lower corner. A break out to test 50% on the previous highest high candle stick wick in day one of the listing (on Kucoin, where I got the chart history from).

免责声明
这些信息和出版物并非旨在提供,也不构成TradingView提供或认可的任何形式的财务、投资、交易或其他类型的建议或推荐。请阅读使用条款了解更多信息。
免责声明
这些信息和出版物并非旨在提供,也不构成TradingView提供或认可的任何形式的财务、投资、交易或其他类型的建议或推荐。请阅读使用条款了解更多信息。