做多
WRX/BTC
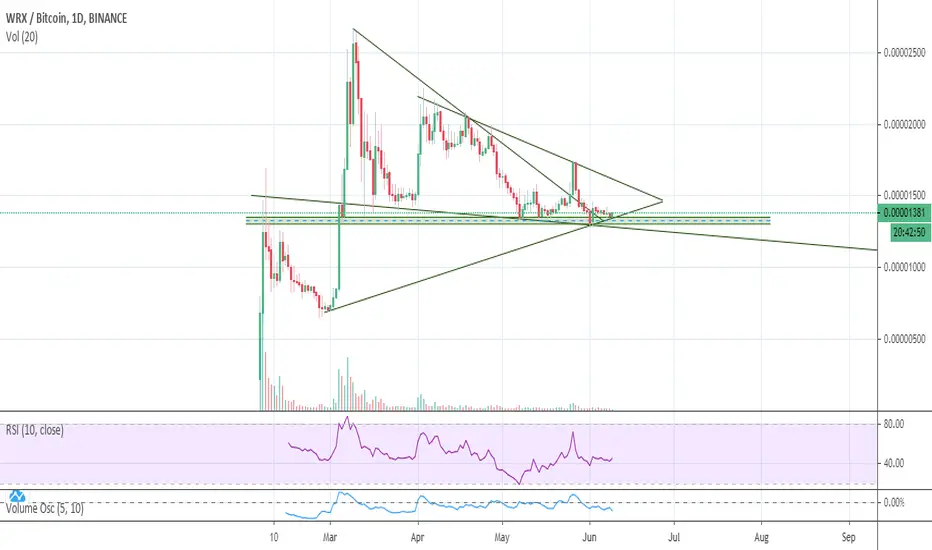
Not an expert. I'm simple, but simple works for me. Buy zone is highlighted just needs some volume to come in. RSI is showing a bullish divergence on the daily.
Break and close below 1270-ish and it's more downside. Break the diagonal trend line and it's more upside!
Break and close below 1270-ish and it's more downside. Break the diagonal trend line and it's more upside!
注释
The diagonal support line that I have drawn is broken, but the horizontal support line is still holding. I'm not sure how this will play out, but I'd certainly be cautious here. If the horizontal line breaks, then there's a lot of space down below. A drop of 50% is certainly not out of the question.Diagonal trend lines are a bit tricky since you can always redraw them to fit your bias.
交易手动结束
See below for updated chart.
免责声明
这些信息和出版物并非旨在提供,也不构成TradingView提供或认可的任何形式的财务、投资、交易或其他类型的建议或推荐。请阅读使用条款了解更多信息。