
1. Market Overview
The peace negotiations between the US and Iran in Geneva have been cancelled, reducing expectations for a long-term ceasefire agreement.
This has raised concerns among investors about the possibility of the **Strait of Hormuz** being closed again, creating bullish momentum for oil prices.
2. Technical Analysis
a. Trend Structure
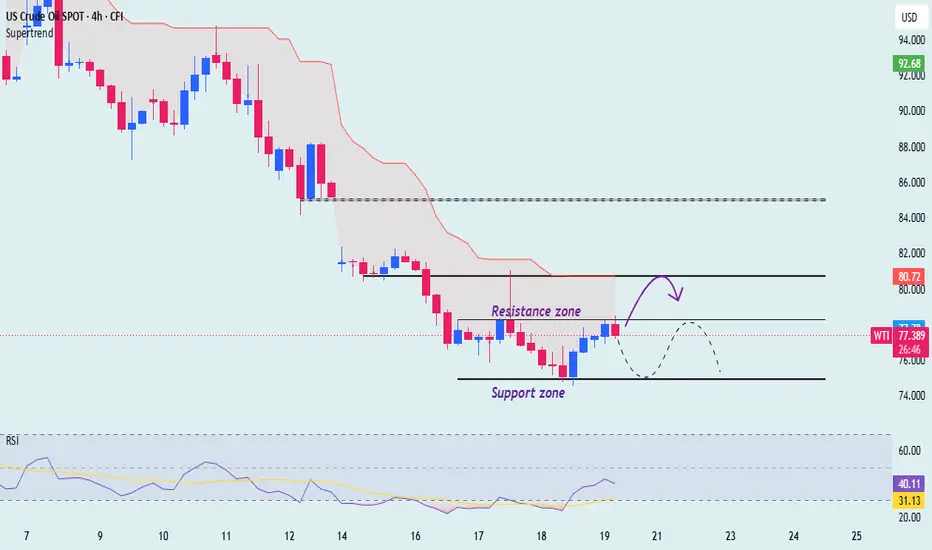
WTI on the H4 timeframe remains within a broader bearish trend.
• Price previously formed a clear **Lower High – Lower Low** structure.
• After breaking below the key support zone around 80.0 – 80.5, sellers regained strong control and pushed price down toward the 75.0 – 76.0 area.
• Currently, price is showing a technical rebound from the lows, but there is no clear confirmation of a trend reversal yet.
📉 The bearish structure remains valid as long as price fails to break above the key resistance area around 78.
b. Key Levels
🔴 Resistance Zone:
• 77.8 – 78.2: Current reaction zone where price is facing resistance.
• This is a short-term supply area where sellers may return.
If price breaks out and closes an H4 candle above this zone:
➡️ WTI could continue recovering toward:
• 80.0 – 80.5 (stronger resistance area)
🟢 Support Zone:
• 75.0 – 75.5: Nearest demand zone.
• Price previously reacted strongly here with buying pressure appearing.
If price breaks below this area:
➡️ WTI could extend lower toward 74.00 , Further downside target: 72.0 – 73.0
3. Outlook
The latest developments regarding the stalled US-Iran negotiations are helping oil prices maintain above the support zone, weakening the previous bearish momentum and creating a potential opportunity for an upside breakout.
WTI is recovering from the support area but remains below a key resistance zone.
The 78 level is the key area to watch — a breakout could bring buyers back into control, while a rejection may trigger renewed selling pressure.
Wish you a successful trading day
The peace negotiations between the US and Iran in Geneva have been cancelled, reducing expectations for a long-term ceasefire agreement.
This has raised concerns among investors about the possibility of the **Strait of Hormuz** being closed again, creating bullish momentum for oil prices.
2. Technical Analysis
a. Trend Structure
WTI on the H4 timeframe remains within a broader bearish trend.
• Price previously formed a clear **Lower High – Lower Low** structure.
• After breaking below the key support zone around 80.0 – 80.5, sellers regained strong control and pushed price down toward the 75.0 – 76.0 area.
• Currently, price is showing a technical rebound from the lows, but there is no clear confirmation of a trend reversal yet.
📉 The bearish structure remains valid as long as price fails to break above the key resistance area around 78.
b. Key Levels
🔴 Resistance Zone:
• 77.8 – 78.2: Current reaction zone where price is facing resistance.
• This is a short-term supply area where sellers may return.
If price breaks out and closes an H4 candle above this zone:
➡️ WTI could continue recovering toward:
• 80.0 – 80.5 (stronger resistance area)
🟢 Support Zone:
• 75.0 – 75.5: Nearest demand zone.
• Price previously reacted strongly here with buying pressure appearing.
If price breaks below this area:
➡️ WTI could extend lower toward 74.00 , Further downside target: 72.0 – 73.0
3. Outlook
The latest developments regarding the stalled US-Iran negotiations are helping oil prices maintain above the support zone, weakening the previous bearish momentum and creating a potential opportunity for an upside breakout.
WTI is recovering from the support area but remains below a key resistance zone.
The 78 level is the key area to watch — a breakout could bring buyers back into control, while a rejection may trigger renewed selling pressure.
Wish you a successful trading day
交易开始
the plan is still on track 
相关出版物
免责声明
这些信息和出版物并非旨在提供,也不构成TradingView提供或认可的任何形式的财务、投资、交易或其他类型的建议或推荐。请阅读使用条款了解更多信息。