
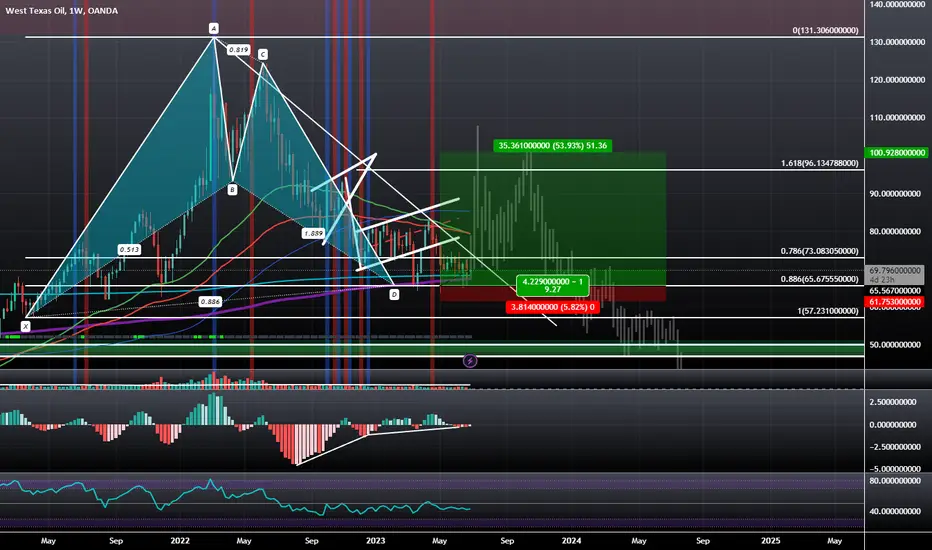
We have a Triple MACD Bullish Divergence at the PCZ of a Bullish Bat that happens to align with the 200-Week SMA and the 800-Week EMA. I have generally been bearish on this chart since the highs back in 2022: tradingview.com/chart/WTICOUSD/YsLzMLja-WTICO-Reversing-at-PCZ-of-Bearish-Shark-on-the-Monthly/, but the persistence it's shown at this Harmonic and Technical level of confluence makes it hard to ignore the potential for at least a 50% move up back to the level of $100.
The 1.618 is at the level of $96.13 but usually if price gets that close to $100, the asset ends up hitting $100, so my target will be $100.
I do think that after it hits the level of $100, it will likely come back down and continue the bearish trend all the way down to even $10, but in the meantime, it looks like there is a decent chance of a short-term rally, which in this case happens to be about a 50% move up from the current level.
The 1.618 is at the level of $96.13 but usually if price gets that close to $100, the asset ends up hitting $100, so my target will be $100.
I do think that after it hits the level of $100, it will likely come back down and continue the bearish trend all the way down to even $10, but in the meantime, it looks like there is a decent chance of a short-term rally, which in this case happens to be about a 50% move up from the current level.
交易结束:到达目标
Closing this trade early at a profit due to the newly formed Bearish pattern seen here: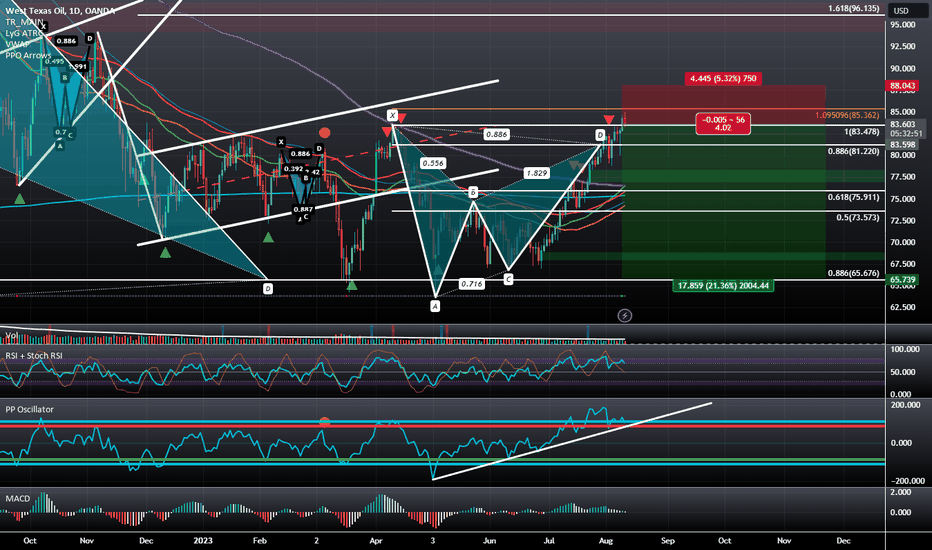

相关出版物
免责声明
这些信息和出版物并非旨在提供,也不构成TradingView提供或认可的任何形式的财务、投资、交易或其他类型的建议或推荐。请阅读使用条款了解更多信息。