
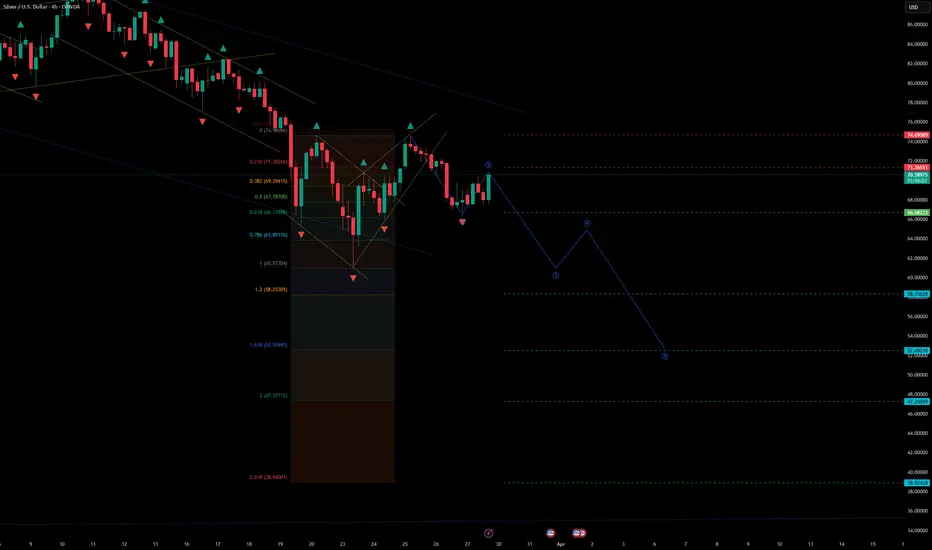
Silver / U.S. Dollar (XAGUSD) — H4
Formation of a Potential Wave 3 + Trendline Retest (Bearish Continuation)
🔎 Market Structure (H4)
On the H4 timeframe, Silver is forming the technical conditions for the development of a potential Wave 3 to the downside, confirmed by:
a breakdown below the corrective trendline (structure shift)
a retest of the broken trendline (confirmation zone)
completion of the pullback phase (Wave 2) near local resistance
loss of bullish momentum and renewed downside pressure after rejection
This setup fits a classic Elliott Wave continuation model, where Wave 3 often accelerates after Wave 2 completes and price fails to reclaim the broken trendline.
📐 Elliott Wave Context
Wave 1: initial impulsive move down (trend initiation)
Wave 2: corrective retracement into resistance / trendline retest
Wave 3: expected impulsive expansion lower (current scenario)
📌 Key principle:
The bearish scenario remains valid as long as price stays below the high of Wave 2.
📍 Entry
Entry: 66.68223
The entry is positioned:
near the retest area of the broken trendline
inside the impulse activation zone after correction completion
aligned with continuation momentum rather than a reversal attempt
🎯 Target Levels (Wave 3 Projections)
Targets are derived from projected impulse expansion zones and key reaction levels:
TP1: 58.35628
TP2: 52.49218
TP3: 47.26049
TP4: 38.92428
Each target represents a potential reaction zone and a logical level for partial profit-taking as Wave 3 develops.
🛑 Invalidation / Stop Loss
Stop Loss: 71.36511
📍 The stop is placed above the high of Wave 2, which:
invalidates the Wave 3 bearish scenario if breached
signals that the correction is extending or structure is shifting bullish
protects against a failed breakdown / trendline reclaim
🧠 Risk & Trade Management
Trend-following setup
Wave 3 can accelerate quickly, so risk control is essential.
Recommended approach:
partial profits at TP1 / TP2
move stop to breakeven after a clean bearish continuation is confirmed
avoid adding early — scale only on intrawave pullbacks that respect resistance
confirmation improves if price holds below the retested trendline on multiple H4 closes
📌 Summary
XAGUSD on H4 shows a trendline breakdown followed by a retest and signs of Wave 2 completion, supporting a potential Wave 3 continuation to the downside.
The bearish scenario remains valid below 71.36511, with downside targets at 58.35628 → 52.49218 → 47.26049 → 38.92428.
Formation of a Potential Wave 3 + Trendline Retest (Bearish Continuation)
🔎 Market Structure (H4)
On the H4 timeframe, Silver is forming the technical conditions for the development of a potential Wave 3 to the downside, confirmed by:
a breakdown below the corrective trendline (structure shift)
a retest of the broken trendline (confirmation zone)
completion of the pullback phase (Wave 2) near local resistance
loss of bullish momentum and renewed downside pressure after rejection
This setup fits a classic Elliott Wave continuation model, where Wave 3 often accelerates after Wave 2 completes and price fails to reclaim the broken trendline.
📐 Elliott Wave Context
Wave 1: initial impulsive move down (trend initiation)
Wave 2: corrective retracement into resistance / trendline retest
Wave 3: expected impulsive expansion lower (current scenario)
📌 Key principle:
The bearish scenario remains valid as long as price stays below the high of Wave 2.
📍 Entry
Entry: 66.68223
The entry is positioned:
near the retest area of the broken trendline
inside the impulse activation zone after correction completion
aligned with continuation momentum rather than a reversal attempt
🎯 Target Levels (Wave 3 Projections)
Targets are derived from projected impulse expansion zones and key reaction levels:
TP1: 58.35628
TP2: 52.49218
TP3: 47.26049
TP4: 38.92428
Each target represents a potential reaction zone and a logical level for partial profit-taking as Wave 3 develops.
🛑 Invalidation / Stop Loss
Stop Loss: 71.36511
📍 The stop is placed above the high of Wave 2, which:
invalidates the Wave 3 bearish scenario if breached
signals that the correction is extending or structure is shifting bullish
protects against a failed breakdown / trendline reclaim
🧠 Risk & Trade Management
Trend-following setup
Wave 3 can accelerate quickly, so risk control is essential.
Recommended approach:
partial profits at TP1 / TP2
move stop to breakeven after a clean bearish continuation is confirmed
avoid adding early — scale only on intrawave pullbacks that respect resistance
confirmation improves if price holds below the retested trendline on multiple H4 closes
📌 Summary
XAGUSD on H4 shows a trendline breakdown followed by a retest and signs of Wave 2 completion, supporting a potential Wave 3 continuation to the downside.
The bearish scenario remains valid below 71.36511, with downside targets at 58.35628 → 52.49218 → 47.26049 → 38.92428.

免责声明
这些信息和出版物并非旨在提供,也不构成TradingView提供或认可的任何形式的财务、投资、交易或其他类型的建议或推荐。请阅读使用条款了解更多信息。
免责声明
这些信息和出版物并非旨在提供,也不构成TradingView提供或认可的任何形式的财务、投资、交易或其他类型的建议或推荐。请阅读使用条款了解更多信息。