
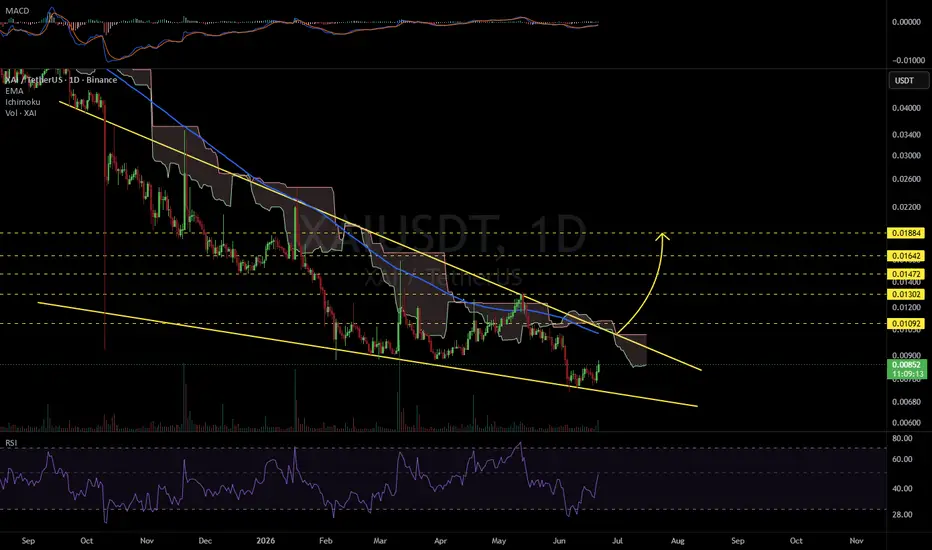
#XAI is moving inside a falling wedge pattern on the daily chart. In case of a breakout above the resistance cluster, which consists of the wedge resistance, the Ichimoku Cloud, and the daily EMA100, the potential upside targets are:
🎯 $0.01092
🎯 $0.01302
🎯 $0.01472
🎯 $0.01642
🎯 $0.01884
⚠️ Always remember to use a tight stop-loss and maintain proper risk management.
🎯 $0.01092
🎯 $0.01302
🎯 $0.01472
🎯 $0.01642
🎯 $0.01884
⚠️ Always remember to use a tight stop-loss and maintain proper risk management.

免责声明
这些信息和出版物并非旨在提供,也不构成TradingView提供或认可的任何形式的财务、投资、交易或其他类型的建议或推荐。请阅读使用条款了解更多信息。
免责声明
这些信息和出版物并非旨在提供,也不构成TradingView提供或认可的任何形式的财务、投资、交易或其他类型的建议或推荐。请阅读使用条款了解更多信息。