
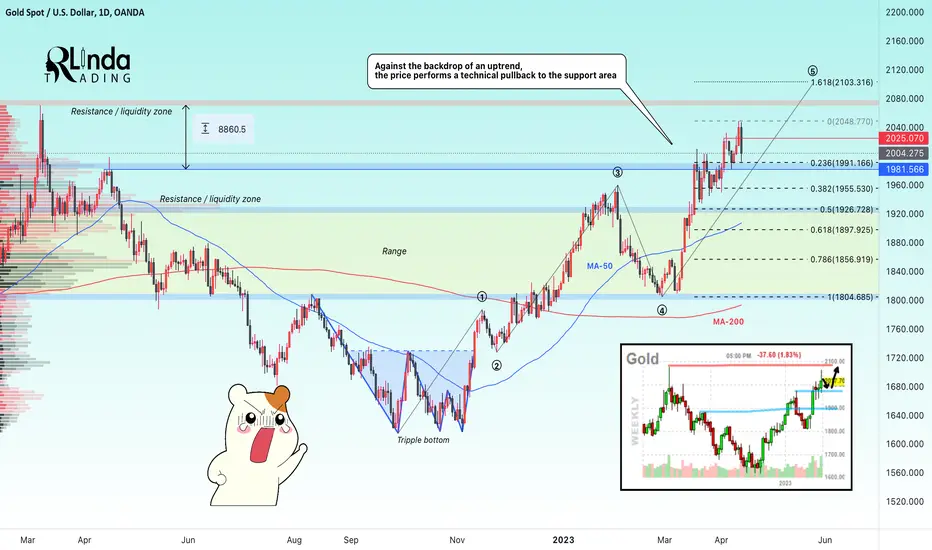
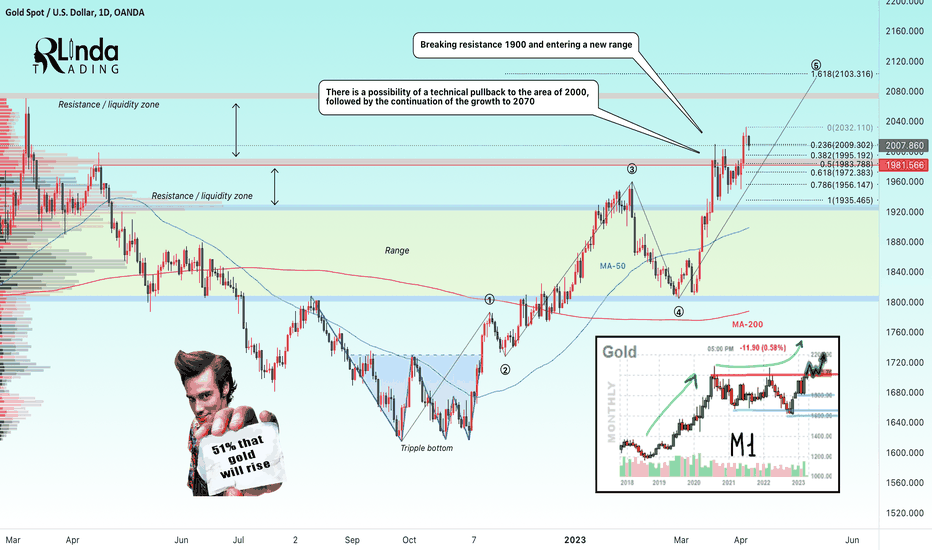
Gold is closing above a strong support level on the weekly timeframe, but at the same time it is sending us a signal for a womzoic decline. What to expect in the coming week?
The long shadow of the weekly candlestick might indicate that the technical pullback might continue, which was shown on the daily timeframe on Friday's closing candlestick (and a false break-down of the resistance at 2025 is worth mentioning as well). The price is testing the 0.236 Fibo level and closing quite close to the support, there is a chance that the price may test it again.
The trend both globally and locally remains with the bulls.
Daily moving averages are acting as support.
The price after breaking through the strong resistance is in the consolidation range phase, which implies possible accumulation of energy to complete the 5th wave of the Elliot, the target of which might be the Fibo level of 1.618 at 2103.
Strong support: 2000 (false-break strategy), 1991 level (Fibo 0.236 (false-break strategy))
Strong resistance: 2025 (break-down strategy), 2050
I expect that after the beginning of the week the price can be red and we might see a retest of level 2000 or even 1991 (1981), but since we have an uptrend with the bulls rather confidently defending the support, I will continue waiting for an increase to 2050
Regards R. Linda!
The long shadow of the weekly candlestick might indicate that the technical pullback might continue, which was shown on the daily timeframe on Friday's closing candlestick (and a false break-down of the resistance at 2025 is worth mentioning as well). The price is testing the 0.236 Fibo level and closing quite close to the support, there is a chance that the price may test it again.
The trend both globally and locally remains with the bulls.
Daily moving averages are acting as support.
The price after breaking through the strong resistance is in the consolidation range phase, which implies possible accumulation of energy to complete the 5th wave of the Elliot, the target of which might be the Fibo level of 1.618 at 2103.
Strong support: 2000 (false-break strategy), 1991 level (Fibo 0.236 (false-break strategy))
Strong resistance: 2025 (break-down strategy), 2050
I expect that after the beginning of the week the price can be red and we might see a retest of level 2000 or even 1991 (1981), but since we have an uptrend with the bulls rather confidently defending the support, I will continue waiting for an increase to 2050
Regards R. Linda!
交易开始

🌹TRADING is a CASINO💔!?
NO‼️
Join me, I'll guide you to PROFITABLE TRADING💵!
(don't copy, click on the links!)
🟢Telegram Channel: telegram.me/RLindaTrade
🧿 Web: rlinda.com
🔴Contact: telegram.me/RLindaSignals
NO‼️
Join me, I'll guide you to PROFITABLE TRADING💵!
(don't copy, click on the links!)
🟢Telegram Channel: telegram.me/RLindaTrade
🧿 Web: rlinda.com
🔴Contact: telegram.me/RLindaSignals
相关出版物
免责声明
这些信息和出版物并非旨在提供,也不构成TradingView提供或认可的任何形式的财务、投资、交易或其他类型的建议或推荐。请阅读使用条款了解更多信息。
🌹TRADING is a CASINO💔!?
NO‼️
Join me, I'll guide you to PROFITABLE TRADING💵!
(don't copy, click on the links!)
🟢Telegram Channel: telegram.me/RLindaTrade
🧿 Web: rlinda.com
🔴Contact: telegram.me/RLindaSignals
NO‼️
Join me, I'll guide you to PROFITABLE TRADING💵!
(don't copy, click on the links!)
🟢Telegram Channel: telegram.me/RLindaTrade
🧿 Web: rlinda.com
🔴Contact: telegram.me/RLindaSignals
相关出版物
免责声明
这些信息和出版物并非旨在提供,也不构成TradingView提供或认可的任何形式的财务、投资、交易或其他类型的建议或推荐。请阅读使用条款了解更多信息。