
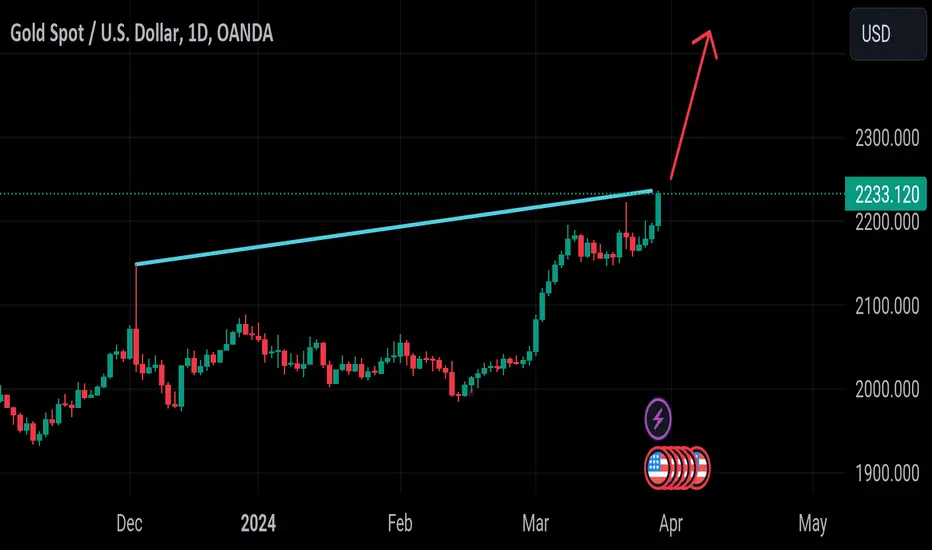
While bullion’s technical profile continues to be bullish, with a clear pattern of higher highs and higher lows, caution is advised, with the 10-week RSI indicator signaling possible overbought conditions. When markets become overextended in a short period of time, corrective pullbacks often follow, even if they turn out to be temporary or relatively minor.
In the event of a bearish shift, support can be identified at $2,145, followed by $2,070, as displayed in the weekly chart attached. Bulls will need to vigorously defend this technical floor; failure to do so may result in a retracement towards the 200-day simple moving average near $1,985. Further down
In the event of a bearish shift, support can be identified at $2,145, followed by $2,070, as displayed in the weekly chart attached. Bulls will need to vigorously defend this technical floor; failure to do so may result in a retracement towards the 200-day simple moving average near $1,985. Further down

免责声明
这些信息和出版物并非旨在提供,也不构成TradingView提供或认可的任何形式的财务、投资、交易或其他类型的建议或推荐。请阅读使用条款了解更多信息。