
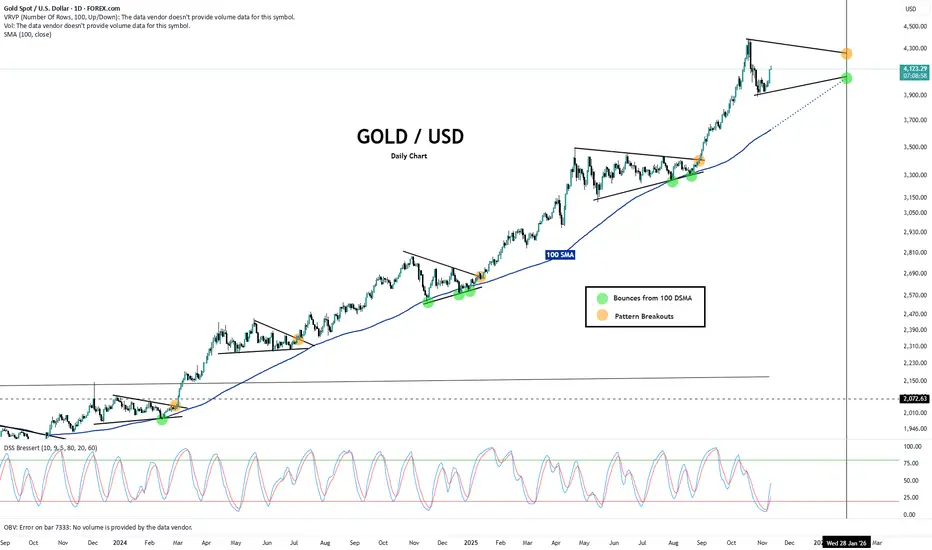
Gold - Pattern that Pays
The chart really speaks for itself.
◻️ The 100 DSMA (blue line) has been a great level for buying / bouncing of price.
◻️ Price falls during corrections to the 100 DSMA.
◻️ Pennants show price compression until price revisits 100 DSMA & then price continue upwards.
◻️ Its important to understand that at some stage in the future, the pennant will fail, price will fall out of the bottom of the pennant, which is where your stop should be placed. This is a real possibility after such a big gold run.
◻️ Breakouts from the upper part of the pennant (orange circles) are another great place to double down on a position, and appears to be a good confirmation of continued upside.
Keep the "cost of mistakes low" with your SL.
My stop loss will be 10% under the 10 DSMA line. I do not automate this because stop loss hunting by exchanges is rife this past several years. So I will manually bow out at approx. 10% price drop from entry, unless I believe it is a stop/liquidation sweep. Given my positions are a small 2 - 3% of my portfolio I am fine having high conviction and willing to lose 10% on these high conviction plays.
Furthermore, it is highly likely gold is on a multi year secular bull market, however, it is probable that we are entering a period where Gold stalls for a few years, so... this is an opportunity to stack and hold Gold for that 2 - 3 year timeframe.
The above chart is to trade on weekly and monthly timeframe, however there is an argument to build a long term stack, in the event a 2 - 3 year correction / sideways move materializes. Gold could be a good place to stack profits from other trades over a 12 - 36 month timeframe, for those of you that are seeking to park profits into some long term safety that gains....for those of you patient enough to execute that
Stay Patient and keep you mistakes cheap
P

相关出版物
免责声明
这些信息和出版物并非旨在提供,也不构成TradingView提供或认可的任何形式的财务、投资、交易或其他类型的建议或推荐。请阅读使用条款了解更多信息。