
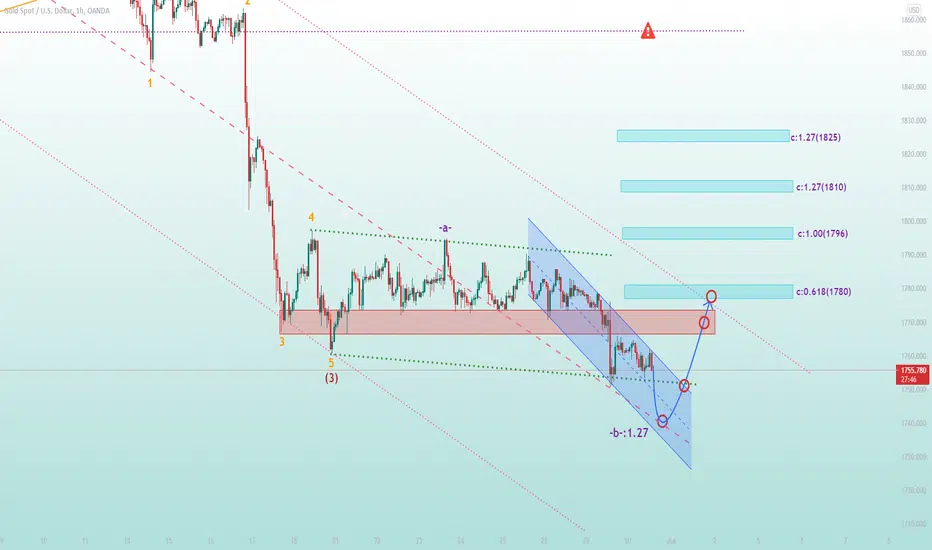
Hello traders, Gold in 30 minutes time, this analysis was done in 30 minutes time frame but is displayed in 1 hour time frame for better visibility.
As you can see in the chart, wave 4 can also be flat, with wave B reacting in Fibo 1.27, so it is probably wave 4, wave C of this flat is expected to react to the bottom of the channel, which can be flat, but if it breaks. The canal becomes an irregular flat that will grow to 1800-1796 and even more.
But in case of support of 1755 support, the triangle pattern for wave 4 is confirmed, in general, we expect the price to rise to the area of 1770, and if the support of 1755 is completely broken, the buy position is not recommended at all.
Friends, if you are interested in putting a signal at the bottom of each analysis, write in the comments ✍🏻
❤️Please, support this idea with a like and comment!❤️
As you can see in the chart, wave 4 can also be flat, with wave B reacting in Fibo 1.27, so it is probably wave 4, wave C of this flat is expected to react to the bottom of the channel, which can be flat, but if it breaks. The canal becomes an irregular flat that will grow to 1800-1796 and even more.
But in case of support of 1755 support, the triangle pattern for wave 4 is confirmed, in general, we expect the price to rise to the area of 1770, and if the support of 1755 is completely broken, the buy position is not recommended at all.
Friends, if you are interested in putting a signal at the bottom of each analysis, write in the comments ✍🏻
❤️Please, support this idea with a like and comment!❤️

免责声明
这些信息和出版物并非旨在提供,也不构成TradingView提供或认可的任何形式的财务、投资、交易或其他类型的建议或推荐。请阅读使用条款了解更多信息。
免责声明
这些信息和出版物并非旨在提供,也不构成TradingView提供或认可的任何形式的财务、投资、交易或其他类型的建议或推荐。请阅读使用条款了解更多信息。