
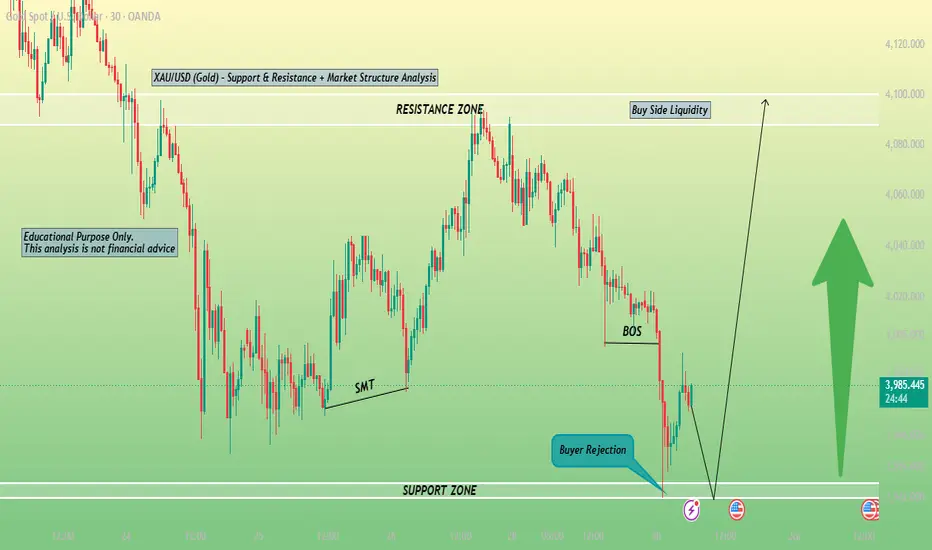
This chart presents an educational technical analysis of the XAU/USD (Gold) market on the 30-minute timeframe. It highlights key Support and Resistance Zones, allowing traders to identify areas where price has historically reacted. The analysis also demonstrates market structure, price movement, and potential reversal or continuation zones based on price action.
The resistance zone marks an area where selling pressure may increase, while the support zone indicates a potential buying interest where price could find stability. Traders should wait for proper confirmation, such as candlestick patterns or market structure breaks, before considering any trading decision.
This chart is created solely for educational and learning purposes to help traders understand support and resistance concepts, market behavior, and price action analysis. It should not be considered financial or investment advice. Always apply proper risk management and confirm your analysis before entering any trade.
The resistance zone marks an area where selling pressure may increase, while the support zone indicates a potential buying interest where price could find stability. Traders should wait for proper confirmation, such as candlestick patterns or market structure breaks, before considering any trading decision.
This chart is created solely for educational and learning purposes to help traders understand support and resistance concepts, market behavior, and price action analysis. It should not be considered financial or investment advice. Always apply proper risk management and confirm your analysis before entering any trade.
交易开始
800 pips runing交易结束:到达目标
1200 PIPS TARGET REACHED 
免责声明
这些信息和出版物并非旨在提供,也不构成TradingView提供或认可的任何形式的财务、投资、交易或其他类型的建议或推荐。请阅读使用条款了解更多信息。
免责声明
这些信息和出版物并非旨在提供,也不构成TradingView提供或认可的任何形式的财务、投资、交易或其他类型的建议或推荐。请阅读使用条款了解更多信息。