
Guys I want to start off by pointing out, that for the last 30 days gold has rallied more then 20%, about 300$ or 3000 pips. Keep this in mind before reading the technicals.
This chart is showing a potential short term trend reversal and signals a trade in the direction of a longer term trend.
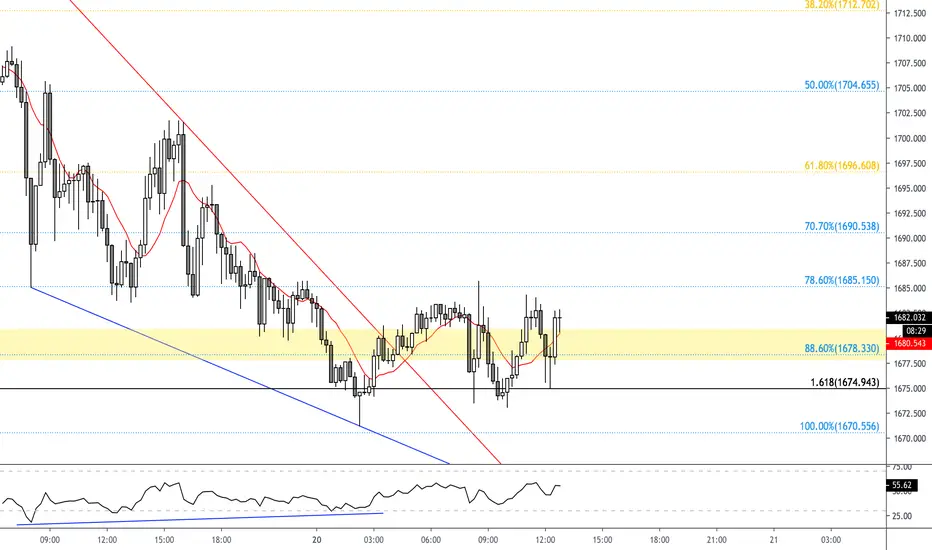
Classic bullish divergence appearing on a chart with price printing lower lows while RSI showing higher highs on a 15 minute chart. Price and momentum starting to converge.
A right angled triangle is drawn on the chart connecting the preceding highs and lows within the divergence, and the triangle appearing as a wedge illustrates support/resistance lines. A break above the resistance signals a shift in bearish momentum.
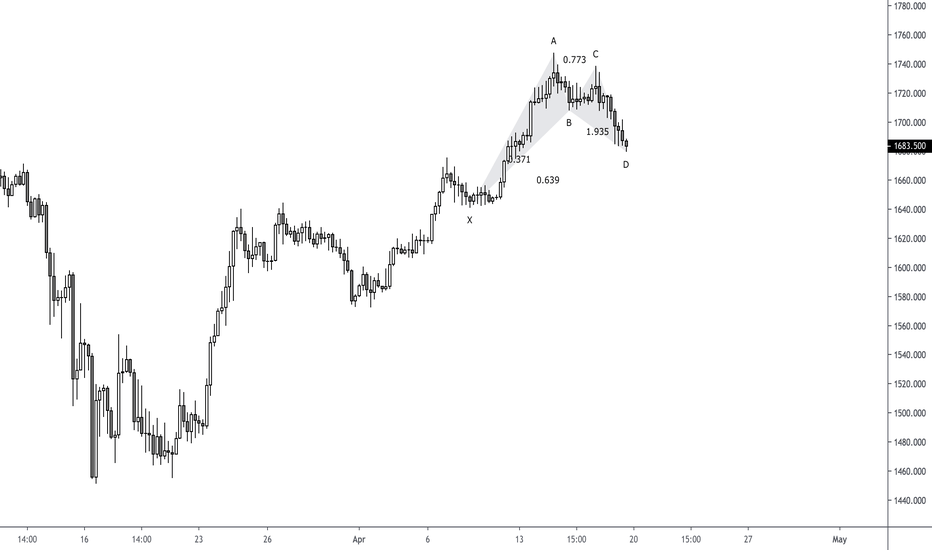
Support has been found with a fibonacci cluster and is now appearing on the chart after the Gartley pattern completion point, which was shared in the previous post:
Thank you for all the likes and comments!
Good luck to all trading gold !!
This chart is showing a potential short term trend reversal and signals a trade in the direction of a longer term trend.
Classic bullish divergence appearing on a chart with price printing lower lows while RSI showing higher highs on a 15 minute chart. Price and momentum starting to converge.
A right angled triangle is drawn on the chart connecting the preceding highs and lows within the divergence, and the triangle appearing as a wedge illustrates support/resistance lines. A break above the resistance signals a shift in bearish momentum.
Support has been found with a fibonacci cluster and is now appearing on the chart after the Gartley pattern completion point, which was shared in the previous post:
Thank you for all the likes and comments!
Good luck to all trading gold !!
注释
Booking some profit here at a 38.2% retracement plotted as 61.8% on the chart
免责声明
这些信息和出版物并非旨在提供,也不构成TradingView提供或认可的任何形式的财务、投资、交易或其他类型的建议或推荐。请阅读使用条款了解更多信息。
免责声明
这些信息和出版物并非旨在提供,也不构成TradingView提供或认可的任何形式的财务、投资、交易或其他类型的建议或推荐。请阅读使用条款了解更多信息。