
The market is not "stable" again.
This is the phase where cash flow is being distributed after completing the liquidity grab above.
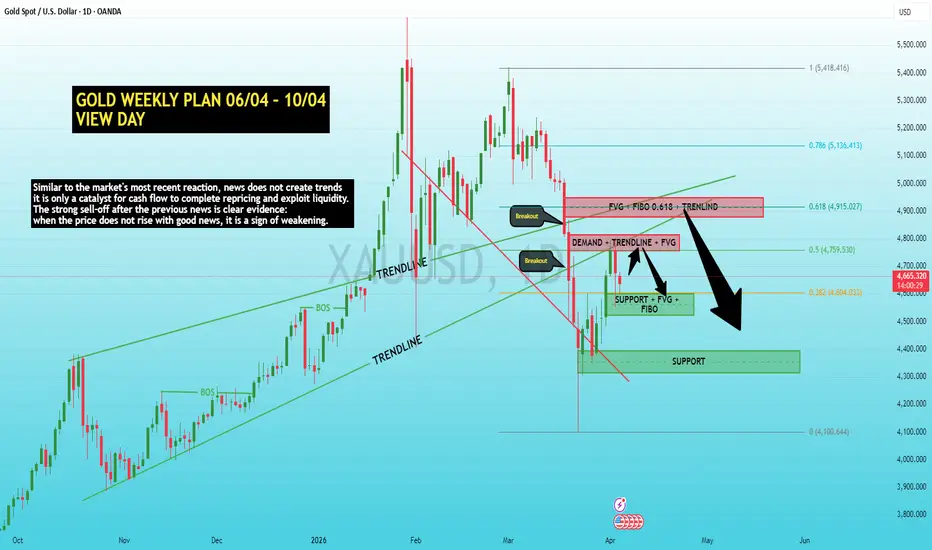
On the D1 frame, gold has confirmed a break in the medium-term upward structure when it broke the trendline and created a clear series of lower highs after the previous strong spike. The recent recovery is just a technical reaction when the price returns to the equilibrium zone around 0.5–0.618 Fibonacci, while also retesting the old demand zone that was broken — currently acting as a supply + distribution zone. The fact that the price cannot maintain above this zone shows that the buying force is no longer in control, and every increase is only serving the ongoing distribution process.
This week's macro context continues to be a factor amplifying volatility. U.S. economic data revolving around inflation and interest rate expectations remain unclear, while renewed military tensions increase short-term psychological factors. However, similar to the market's most recent reaction, news does not create trends — it is only a catalyst for cash flow to complete repricing and exploit liquidity. The strong sell-off after the previous news is clear evidence: when the price does not rise with good news, it is a sign of weakening.
Currently, the 4,900–5,000 zone acts as a key resistance area with the confluence of FVG + Fibonacci 0.618 + trendline breakdown. If the price continues to be rejected here or cannot clearly reclaim this zone, the main scenario remains a continuation down to lower liquidity zones. The areas to watch below include 4,600 → 4,530 → deeper to 4,300, where there are support and liquidity zones that have not been fully tested.
Conversely, if the market can hold above 4,900 and rebuild a higher low structure on D1, then the recovery may extend to the 5,100–5,300 zone. However, in the current context, this scenario has a lower probability and should still be seen as a recovery within a larger downtrend structure until a clear accumulation process over time appears.
The market does not reverse just because of a strong increase. The real bottom does not come from a spike, but from a long enough accumulation to completely break market expectations. Currently, that factor has not appeared. Cash flow is still taking advantage of recovery phases to distribute, and the main trend remains bearish for the week of 06/04 – 10/04 if key resistance zones are not conquered.
LucasGrayTrading
This is the phase where cash flow is being distributed after completing the liquidity grab above.
On the D1 frame, gold has confirmed a break in the medium-term upward structure when it broke the trendline and created a clear series of lower highs after the previous strong spike. The recent recovery is just a technical reaction when the price returns to the equilibrium zone around 0.5–0.618 Fibonacci, while also retesting the old demand zone that was broken — currently acting as a supply + distribution zone. The fact that the price cannot maintain above this zone shows that the buying force is no longer in control, and every increase is only serving the ongoing distribution process.
This week's macro context continues to be a factor amplifying volatility. U.S. economic data revolving around inflation and interest rate expectations remain unclear, while renewed military tensions increase short-term psychological factors. However, similar to the market's most recent reaction, news does not create trends — it is only a catalyst for cash flow to complete repricing and exploit liquidity. The strong sell-off after the previous news is clear evidence: when the price does not rise with good news, it is a sign of weakening.
Currently, the 4,900–5,000 zone acts as a key resistance area with the confluence of FVG + Fibonacci 0.618 + trendline breakdown. If the price continues to be rejected here or cannot clearly reclaim this zone, the main scenario remains a continuation down to lower liquidity zones. The areas to watch below include 4,600 → 4,530 → deeper to 4,300, where there are support and liquidity zones that have not been fully tested.
Conversely, if the market can hold above 4,900 and rebuild a higher low structure on D1, then the recovery may extend to the 5,100–5,300 zone. However, in the current context, this scenario has a lower probability and should still be seen as a recovery within a larger downtrend structure until a clear accumulation process over time appears.
The market does not reverse just because of a strong increase. The real bottom does not come from a spike, but from a long enough accumulation to completely break market expectations. Currently, that factor has not appeared. Cash flow is still taking advantage of recovery phases to distribute, and the main trend remains bearish for the week of 06/04 – 10/04 if key resistance zones are not conquered.
LucasGrayTrading
注释
PMI does not change the trend – so what really causes gold to fluctuate this week?After the PMI data, gold showed almost no significant reversal reaction, once again confirming that news does not create trends, but only acts as a catalyst for the market to complete its existing structure. On the D1 frame, the price is still moving below the FVG area + fibo 0.618 + resistance trendline, while sideways around the demand area + lower FVG (0.382–0.5), indicating the market is in a rebalancing phase after the previous strong decline.
This week is considered extremely sensitive as a series of major news appears simultaneously, including Trump's speech early morning on 08/04, FOMC, CPI, and developments related to the conflict. However, it is important to understand that these factors mainly create spikes and liquidity sweeps, rather than completely changing the market structure. In the current context, the main trend still leans towards bearish after breaking the previous upward structure, and the rebounds to the 47xx–49xx area are likely to only serve as redistribution zones before continuing the downward trend.
Therefore, the priority strategy remains to wait for the price to rebound to premium areas to find selling opportunities according to the structure, rather than chasing short-term fluctuations caused by news. If the 45xx support area is broken, the market can completely expand down to deeper liquidity areas around 43xx–42xx. Conversely, if the price holds the current area, a technical rebound can still occur before the market makes the next decision. This is the "answering questions" phase of the market, and traders need to patiently observe how the price reacts to each key area instead of trying to predict the news.

Daily trend & Supply/Demand insights 📊
👉 t.me/+cZC_DmEr3OwzOTA1
High-probability zones & structured setups
Clear scenarios for better decision-making
Trade smarter with LucasGrayTrading 🎖
👉 t.me/+cZC_DmEr3OwzOTA1
High-probability zones & structured setups
Clear scenarios for better decision-making
Trade smarter with LucasGrayTrading 🎖
免责声明
这些信息和出版物并非旨在提供,也不构成TradingView提供或认可的任何形式的财务、投资、交易或其他类型的建议或推荐。请阅读使用条款了解更多信息。
Daily trend & Supply/Demand insights 📊
👉 t.me/+cZC_DmEr3OwzOTA1
High-probability zones & structured setups
Clear scenarios for better decision-making
Trade smarter with LucasGrayTrading 🎖
👉 t.me/+cZC_DmEr3OwzOTA1
High-probability zones & structured setups
Clear scenarios for better decision-making
Trade smarter with LucasGrayTrading 🎖
免责声明
这些信息和出版物并非旨在提供,也不构成TradingView提供或认可的任何形式的财务、投资、交易或其他类型的建议或推荐。请阅读使用条款了解更多信息。