
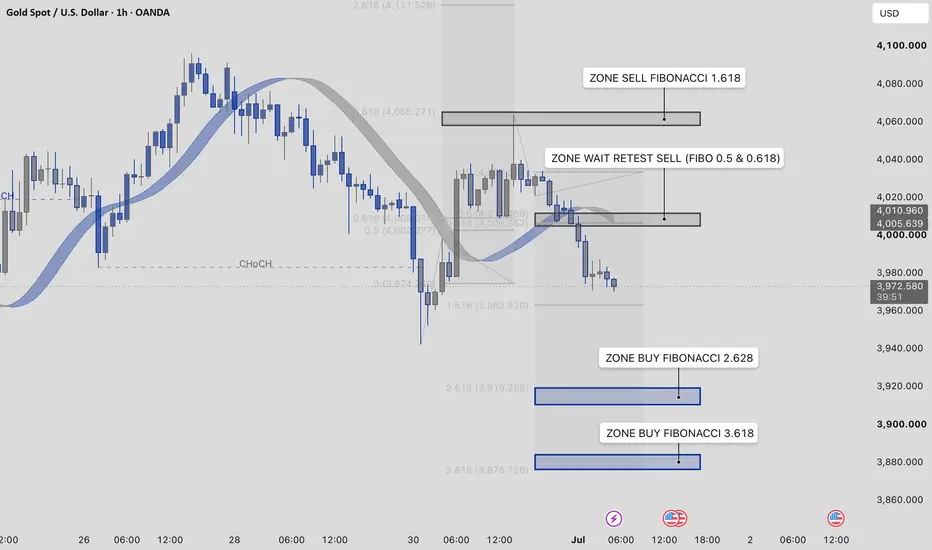
Fibonacci Extension Levels
Key ratios used: 61.8% – 100% – 161.8% – 261.8% – 361.8% – 416.8%…
How and When to Use It
Condition: Fibonacci Extensions are applied when the primary trend (Trend 1) resumes—specifically when the secondary trend (the correction) breaks through the key resistance/support of the primary trend.
Purpose: To measure the expansion and potential targets of the primary trend.
---
Practical Trading Application
In live trading, we primarily rely on standard Support and Resistance (S&R) zones to take profits—targeting areas of previous liquidity traps (trapped buyers/sellers) and exiting just before major S&R levels.
However, when price breaks through all historical barriers and enters price discovery mode (creating new all-time highs or lows), Fibonacci Extension becomes an invaluable tool to project where the price might head next.
> The Reality of Profit Taking:
> In financial markets, finding the perfect exit is incredibly challenging because no one can predict the absolute peak or trough.
While Fibonacci Extension levels can feel somewhat subjective, historical data and market psychology show that **the 161.8% and 261.8% targets have an exceptionally high accuracy rate.**
Advanced Confluence & Trend Reversals
During certain market cycles, price often faces major exhaustion and potential trend reversals exactly at the 261.8% extension level.
By combining Fibonacci Extensions with key technical filters—such as **RSI/MACD divergences** or **Elliott Wave counts**—you can highly accurately anticipate the exhaustion point or reversal of a trend within a specific timeframe.
---
*What are your thoughts on these levels? Do you prefer the 161.8% or 261.8% for your final targets? Let me know in the comments!*

相关出版物
免责声明
这些信息和出版物并非旨在提供,也不构成TradingView提供或认可的任何形式的财务、投资、交易或其他类型的建议或推荐。请阅读使用条款了解更多信息。