
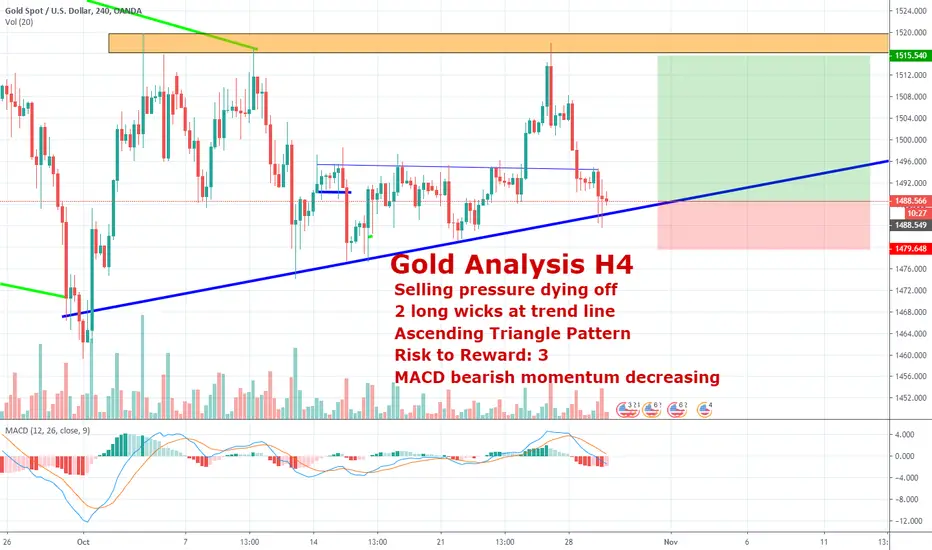
Hey traders, as the day comes to a close, I am looking at this setup for Gold on the H4 charts.
I have drawn from what I see an ascending triangle pattern. Price has come down to test the ascending line, with 2 long wicks forming on the H4.
This represents demand from buyers who are either taking profit or entering into long positions.
The risk to reward of this trade is 3.
There is a minor S/R at 1495, so if price can break that, then I am really bullish until the major S/R.
On the MACD we can also see that although bearish, the momentum for the bears seems to be decreasing.
Daily trade analysis and ideas:
Telegram: t.me/Forexdojo
Facebook: facebook.com/FXShinobi
Twitter: forex_dojo
Instagram: instagram.com/jaylen.forex/
Website: forexshinobi.com
Tiktok: Forexshinobi
ForexShinobi
I have drawn from what I see an ascending triangle pattern. Price has come down to test the ascending line, with 2 long wicks forming on the H4.
This represents demand from buyers who are either taking profit or entering into long positions.
The risk to reward of this trade is 3.
There is a minor S/R at 1495, so if price can break that, then I am really bullish until the major S/R.
On the MACD we can also see that although bearish, the momentum for the bears seems to be decreasing.
Daily trade analysis and ideas:
Telegram: t.me/Forexdojo
Facebook: facebook.com/FXShinobi
Twitter: forex_dojo
Instagram: instagram.com/jaylen.forex/
Website: forexshinobi.com
Tiktok: Forexshinobi
ForexShinobi

免责声明
这些信息和出版物并非旨在提供,也不构成TradingView提供或认可的任何形式的财务、投资、交易或其他类型的建议或推荐。请阅读使用条款了解更多信息。