 XAUUSD
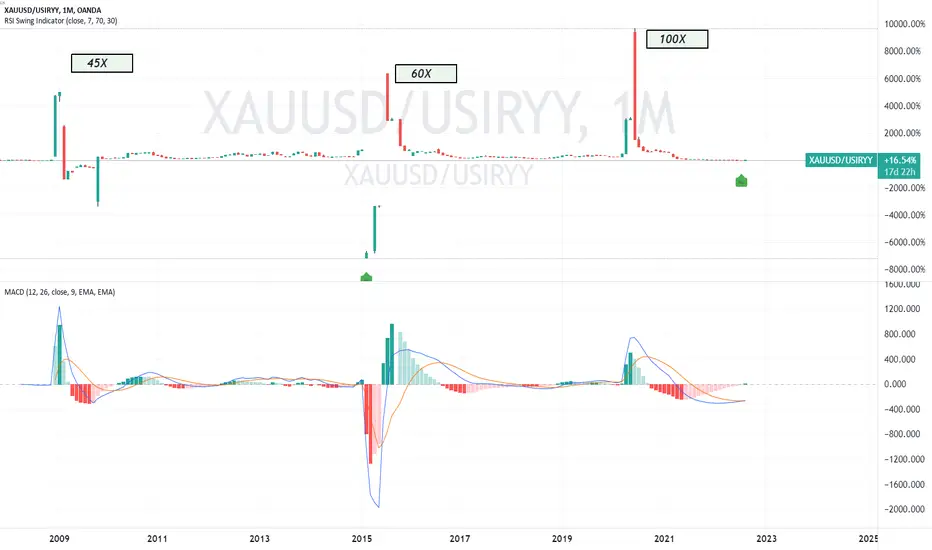
The MONTHLY chart shows the ratio between the spot gold price
and the US inflation rate.
While overall, the ratio is quite stable or consolidated for a period
of more than 15 years.
Hpwever. y three episodes are noted where the ratio rose parabolically
including 2009, 2015 and the Covid 2022 time period
.
For the present, the RSI Swing Indicator has printed a Buy Signal.
and
the MACD shows an early K/D crossover under the histogram.
Does this suggest an impending hard Bullrun for XAUUSD?
Please comment and offer your opinion.
XAUUSD
免责声明
这些信息和出版物并非旨在提供,也不构成TradingView提供或认可的任何形式的财务、投资、交易或其他类型的建议或推荐。请阅读使用条款了解更多信息。
免责声明
这些信息和出版物并非旨在提供,也不构成TradingView提供或认可的任何形式的财务、投资、交易或其他类型的建议或推荐。请阅读使用条款了解更多信息。