
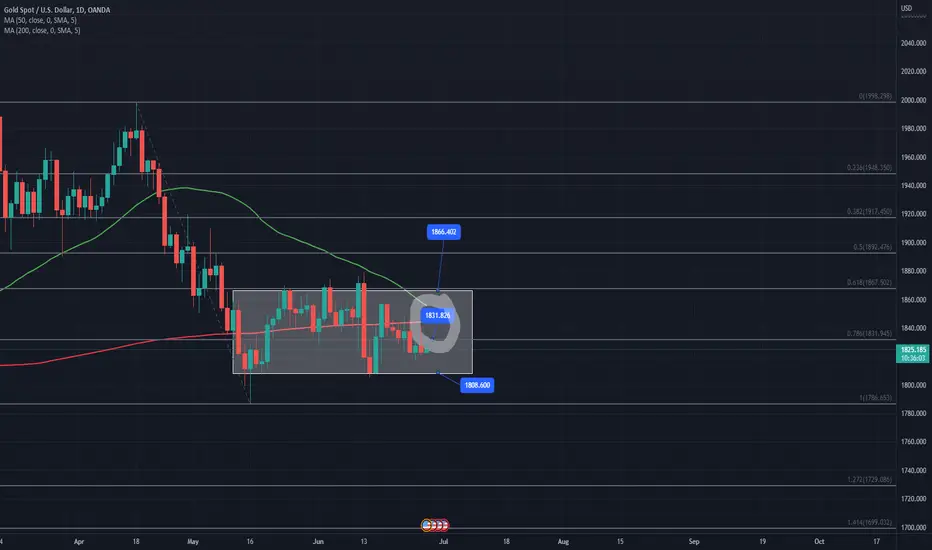
50 MA --> 🟢
200 MA --> 🔴
What is Death Cross ?
The death cross is a chart pattern that signals a growing weakness in an asset's price. It comprises two separate lines called “moving averages.” Each moving average line (MA) is formed by calculating the average price over a certain period of time and using those points to create a smoothed line.
An example of a death cross is circled in gray.
If you want to see indicator signals:
Median : Sell
Parabolic SAR : Sell
SuperTrend : Sell
Awesome Ossillator : Sell
Williams Alligator : Sell
Support Level :
🛑1805-1810
Resistance Level :
🎯1830
🎯1865
Not Financial Advice
200 MA --> 🔴
What is Death Cross ?
The death cross is a chart pattern that signals a growing weakness in an asset's price. It comprises two separate lines called “moving averages.” Each moving average line (MA) is formed by calculating the average price over a certain period of time and using those points to create a smoothed line.
An example of a death cross is circled in gray.
If you want to see indicator signals:
Median : Sell
Parabolic SAR : Sell
SuperTrend : Sell
Awesome Ossillator : Sell
Williams Alligator : Sell
Support Level :
🛑1805-1810
Resistance Level :
🎯1830
🎯1865
Not Financial Advice

免责声明
这些信息和出版物并非旨在提供,也不构成TradingView提供或认可的任何形式的财务、投资、交易或其他类型的建议或推荐。请阅读使用条款了解更多信息。
免责声明
这些信息和出版物并非旨在提供,也不构成TradingView提供或认可的任何形式的财务、投资、交易或其他类型的建议或推荐。请阅读使用条款了解更多信息。