
1. Fundamental Context
New Record: Spot gold has hit an all-time high of $4,400 per ounce as of Monday.
Growth Drivers: This surge is propelled by expectations of further U.S. Federal Reserve rate cuts, sustained safe-haven demand due to geopolitical tensions, and a softer dollar.
Annual Performance: Gold is up 67% for the year, driven by robust central bank buying and trade tensions.
2. Technical Analysis (1h Chart)
Based on the technical indicators and Volume Profile:
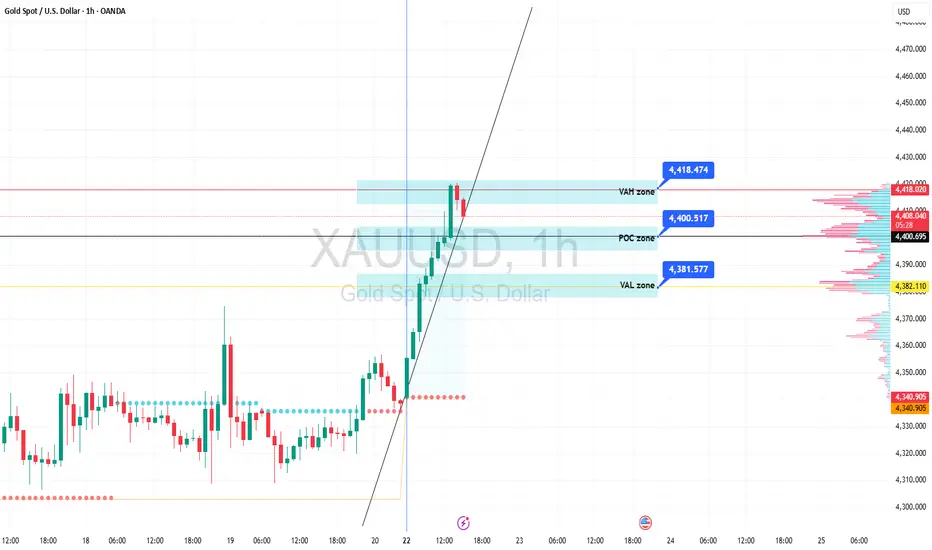
Trend Structure: The price is in a strong uptrend, hugging a very steep ascending trendline.
Key Value Areas:
VAH (Value Area High) - $4,418.474: This is the upper boundary of the value area, currently acting as immediate resistance.
POC (Point of Control) - $4,400.517: The level with the highest traded volume, aligning with the $4,400 psychological record, forming a very strong support zone.
VAL (Value Area Low) - $4,381.577: The lower boundary of the value area and the final support level to maintain the short-term bullish structure.
Market Flow: Institutional flow continues to control the market structure, with no signs of distribution or trend reversal.
3. Market Outlook & Scenarios
Continuation Scenario: Buy orders are being executed at pullback zones after the market completes expansion phases and sweeps liquidity. If the price closes firmly above the VAH ($4,418), Gold will likely continue its "price discovery" phase toward new highs.
Correction Scenario: Should a retracement occur, the POC ($4,400) zone will be the pivotal anchor. A pullback to this area is viewed as an opportunity for institutional investors to push prices higher within the sustained uptrend.
Summary: Gold remains extremely Bullish. The primary strategy is to monitor price action at the $4,400 POC zone to seek opportunities in line with the prevailing trend.
New Record: Spot gold has hit an all-time high of $4,400 per ounce as of Monday.
Growth Drivers: This surge is propelled by expectations of further U.S. Federal Reserve rate cuts, sustained safe-haven demand due to geopolitical tensions, and a softer dollar.
Annual Performance: Gold is up 67% for the year, driven by robust central bank buying and trade tensions.
2. Technical Analysis (1h Chart)
Based on the technical indicators and Volume Profile:
Trend Structure: The price is in a strong uptrend, hugging a very steep ascending trendline.
Key Value Areas:
VAH (Value Area High) - $4,418.474: This is the upper boundary of the value area, currently acting as immediate resistance.
POC (Point of Control) - $4,400.517: The level with the highest traded volume, aligning with the $4,400 psychological record, forming a very strong support zone.
VAL (Value Area Low) - $4,381.577: The lower boundary of the value area and the final support level to maintain the short-term bullish structure.
Market Flow: Institutional flow continues to control the market structure, with no signs of distribution or trend reversal.
3. Market Outlook & Scenarios
Continuation Scenario: Buy orders are being executed at pullback zones after the market completes expansion phases and sweeps liquidity. If the price closes firmly above the VAH ($4,418), Gold will likely continue its "price discovery" phase toward new highs.
Correction Scenario: Should a retracement occur, the POC ($4,400) zone will be the pivotal anchor. A pullback to this area is viewed as an opportunity for institutional investors to push prices higher within the sustained uptrend.
Summary: Gold remains extremely Bullish. The primary strategy is to monitor price action at the $4,400 POC zone to seek opportunities in line with the prevailing trend.

相关出版物
免责声明
这些信息和出版物并非旨在提供,也不构成TradingView提供或认可的任何形式的财务、投资、交易或其他类型的建议或推荐。请阅读使用条款了解更多信息。