
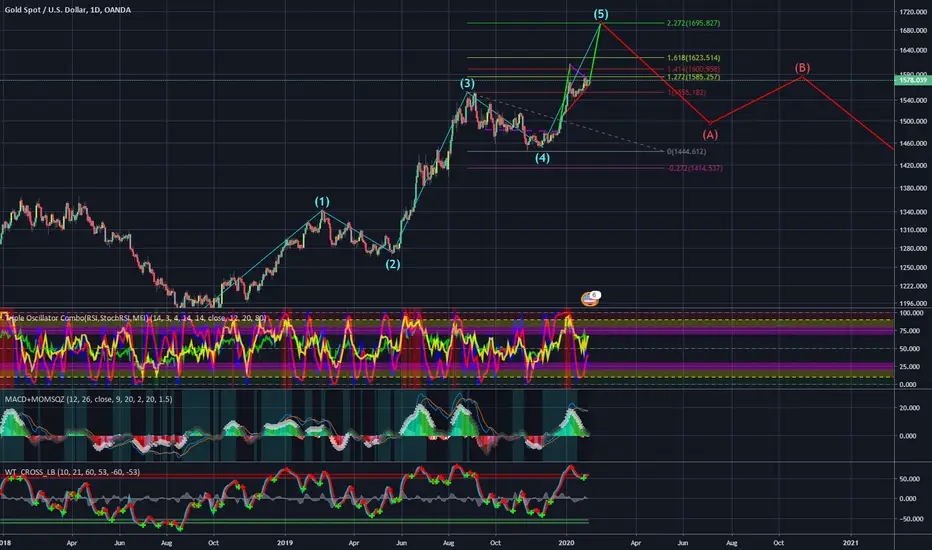
Is this a bullish pennant or just a symmetrical triangle? Up or down?
Decision time for gold!
Indicators @ 1D TF:
Dissipation of bullish momentum on squeeze momentum indicator
Stoch RSI also does not look bullish anymore.
Indicators @ H4 TF:
Bullish momentum on squeeze momentum indicator
MACD bullish crossover
Stoch RSI = bullish
Wave trend oscillator = bullish
Bullish target of bullish pennant ~ $1695
Beraish target#1 of Symmetrical triangle ~ $1500 (end of wave A)
Beraish target#2 of Symmetrical triangle ~ $1415 (end of wave C)
Note:
Squeeze momentum indicator @ 1W TF still looks very bullish.
Therefore, a breakout to the upside could be likely (bullish pennant scenario).
However, if bullish mometum is too weak the triangle could break to the downside.
For this reason I would recommend to take some profits at current price level to secure them.
Remaining gold position I suggest to sell at bullish pennant target.
I´m not a financial adviser. For educational purpose only!
Decision time for gold!
Indicators @ 1D TF:
Dissipation of bullish momentum on squeeze momentum indicator
Stoch RSI also does not look bullish anymore.
Indicators @ H4 TF:
Bullish momentum on squeeze momentum indicator
MACD bullish crossover
Stoch RSI = bullish
Wave trend oscillator = bullish
Bullish target of bullish pennant ~ $1695
Beraish target#1 of Symmetrical triangle ~ $1500 (end of wave A)
Beraish target#2 of Symmetrical triangle ~ $1415 (end of wave C)
Note:
Squeeze momentum indicator @ 1W TF still looks very bullish.
Therefore, a breakout to the upside could be likely (bullish pennant scenario).
However, if bullish mometum is too weak the triangle could break to the downside.
For this reason I would recommend to take some profits at current price level to secure them.
Remaining gold position I suggest to sell at bullish pennant target.
I´m not a financial adviser. For educational purpose only!

免责声明
这些信息和出版物并非旨在提供,也不构成TradingView提供或认可的任何形式的财务、投资、交易或其他类型的建议或推荐。请阅读使用条款了解更多信息。