
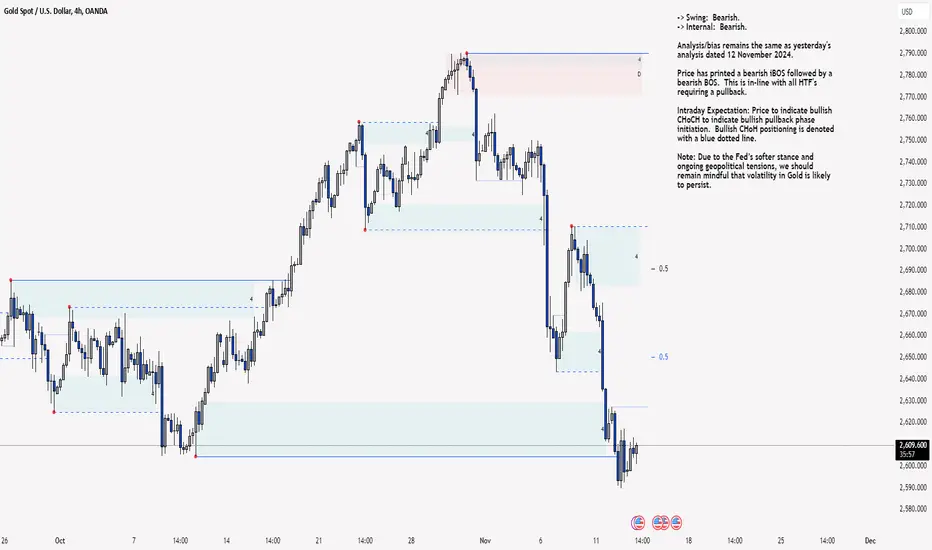
H4 Analysis:
-> Swing: Bearish.
-> Internal: Bearish.
Analysis/bias remains the same as yesterday's analysis dated 12 November 2024.
Price has printed a bearish iBOS followed by a bearish BOS. This is in-line with all HTF's requiring a pullback.
Intraday Expectation: Price to indicate bullish CHoCH to indicate bullish pullback phase initiation. Bullish CHoH positioning is denoted with a blue dotted line.
Note: Due to the Fed’s softer stance and ongoing geopolitical tensions, we should remain mindful that volatility in Gold is likely to persist.
H4 Chart:
M15 Analysis:
-> Swing: Bearish.
-> Internal: Bearish.
Analysis/bias remains the same as yesterday's analysis dated 12 November 2024.
As mentioned in my analysis dated 8 November 2024 that I would not be surprised if price printed a bearish iBOS.
Price Action Analysis: This is how price printed, printing a bearish iBOS followed by a bearish BOS.
Price has printed a bullish CHoCH indicating bullish pullback phase initiation. We are now trading within an established internal range.
This is in-line with all HTF's need for a pullback.
Intraday Expectation: Price to trade up to either premium of internal 50% EQ or M15 demand zone before targeting weak internal low priced at 2,589.725.
Note: With the Fed's softer policy stance and escalating geopolitical tensions, elevated price volatility is likely to persist.
M15 Chart:
-> Swing: Bearish.
-> Internal: Bearish.
Analysis/bias remains the same as yesterday's analysis dated 12 November 2024.
Price has printed a bearish iBOS followed by a bearish BOS. This is in-line with all HTF's requiring a pullback.
Intraday Expectation: Price to indicate bullish CHoCH to indicate bullish pullback phase initiation. Bullish CHoH positioning is denoted with a blue dotted line.
Note: Due to the Fed’s softer stance and ongoing geopolitical tensions, we should remain mindful that volatility in Gold is likely to persist.
H4 Chart:
M15 Analysis:
-> Swing: Bearish.
-> Internal: Bearish.
Analysis/bias remains the same as yesterday's analysis dated 12 November 2024.
As mentioned in my analysis dated 8 November 2024 that I would not be surprised if price printed a bearish iBOS.
Price Action Analysis: This is how price printed, printing a bearish iBOS followed by a bearish BOS.
Price has printed a bullish CHoCH indicating bullish pullback phase initiation. We are now trading within an established internal range.
This is in-line with all HTF's need for a pullback.
Intraday Expectation: Price to trade up to either premium of internal 50% EQ or M15 demand zone before targeting weak internal low priced at 2,589.725.
Note: With the Fed's softer policy stance and escalating geopolitical tensions, elevated price volatility is likely to persist.
M15 Chart:

免责声明
这些信息和出版物并非旨在提供,也不构成TradingView提供或认可的任何形式的财务、投资、交易或其他类型的建议或推荐。请阅读使用条款了解更多信息。