Gold ( XAUUSD) Daily: Apex Decision Node at Upper Channel Resistance Following 200-EMA Reclaim
### 🪙 Gold Spot / U.S. Dollar (XAUUSD) Daily Technical Matrix (Ref: XAUUSD_2026-08-10_09-32-32.png)
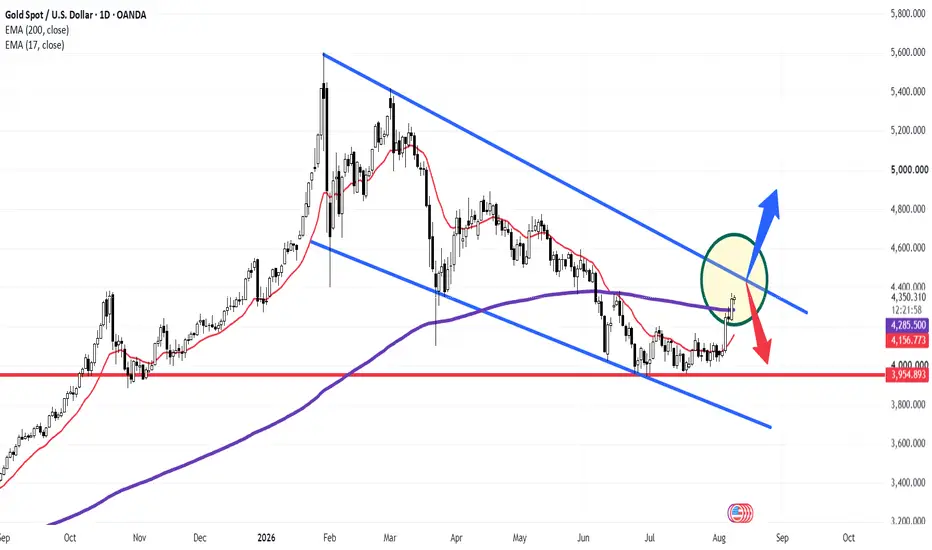
We are deploying an updated Daily (1D) structural framework on Gold Spot (XAUUSD). Following a powerful rebound off the major horizontal floor at **3,954.893**, price action has successfully reclaimed its key moving averages and advanced directly into a major dynamic decision junction inside the highlighted yellow zone.
Gold is currently trading under firm buy-side momentum at **4,354.195 (+0.28%)**, pressing directly against the upper descending channel boundary.
---
### 🔍 Technical Architecture & Confluence Node:
Our quantitative setup highlights a crucial structural test inside the yellow circle:
1. **Moving Average Reclaim (EMA 17 & 200):** Bullish momentum drove price action above both the **17-period EMA (red line at 4,157.204)** and the institutional **200-period EMA (purple line at 4,285.538)**, converting these key lines into dynamic support floors.
2. **Descending Channel Ceiling Test (Blue Line):** The active rally has collided with the primary descending trendline (upper blue channel boundary) near **4,360.00 – 4,400.00**, setting up an immediate breakout vs. rejection scenario.
3. **Primary Structural Base:** The broader multi-month consolidation remains anchored above the horizontal static support ceiling at **3,954.893**.
---
### 🛡️ Strategic Operational Scenarios (Blue vs. Red Arrow Vectors):
* **Scenario A — Bullish Channel Breakout (Blue Arrow):** A decisive daily close above the upper blue trendline (clearing **4,400.00**) confirms a major structural trend reversal, opening upside target corridors toward **4,600.00** and **4,800.00**.
* **Scenario B — Dynamic Channel Rejection (Red Arrow):** Overhead supply absorption at channel resistance would trigger a corrective pullback to retest the reclaimed **200-period EMA (4,285.538)** or the **17-period EMA (4,157.204)** to gather fresh demand.
### 📊 Tactical Parameters Summary:
* **Current Bias:** Neutral-Bullish / Apex Resistance Testing Node
* **Key Dynamic Resistance Ceiling:** 4,360.00 – 4,400.00
* **Immediate Dynamic Support (200-EMA):** 4,285.538
* **Secondary Dynamic Base (17-EMA):** 4,157.204
* **Macro Horizontal Floor:** 3,954.893
---
📊 **ChartPro Data**
*Precious Metals Architecture, Moving Average Confluences & Systematic Risk Management.*
⚠️ **Disclaimer:** For educational and informational purposes only. This active market study represents a personal trading framework and does not constitute financial or investment advice.
XAUUSD) Daily: Apex Decision Node at Upper Channel Resistance Following 200-EMA Reclaim### 🪙 Gold Spot / U.S. Dollar (
XAUUSD) Daily Technical Matrix (Ref: XAUUSD_2026-08-10_09-32-32.png)We are deploying an updated Daily (1D) structural framework on Gold Spot (
XAUUSD). Following a powerful rebound off the major horizontal floor at **3,954.893**, price action has successfully reclaimed its key moving averages and advanced directly into a major dynamic decision junction inside the highlighted yellow zone.Gold is currently trading under firm buy-side momentum at **4,354.195 (+0.28%)**, pressing directly against the upper descending channel boundary.
---
### 🔍 Technical Architecture & Confluence Node:
Our quantitative setup highlights a crucial structural test inside the yellow circle:
1. **Moving Average Reclaim (EMA 17 & 200):** Bullish momentum drove price action above both the **17-period EMA (red line at 4,157.204)** and the institutional **200-period EMA (purple line at 4,285.538)**, converting these key lines into dynamic support floors.
2. **Descending Channel Ceiling Test (Blue Line):** The active rally has collided with the primary descending trendline (upper blue channel boundary) near **4,360.00 – 4,400.00**, setting up an immediate breakout vs. rejection scenario.
3. **Primary Structural Base:** The broader multi-month consolidation remains anchored above the horizontal static support ceiling at **3,954.893**.
---
### 🛡️ Strategic Operational Scenarios (Blue vs. Red Arrow Vectors):
* **Scenario A — Bullish Channel Breakout (Blue Arrow):** A decisive daily close above the upper blue trendline (clearing **4,400.00**) confirms a major structural trend reversal, opening upside target corridors toward **4,600.00** and **4,800.00**.
* **Scenario B — Dynamic Channel Rejection (Red Arrow):** Overhead supply absorption at channel resistance would trigger a corrective pullback to retest the reclaimed **200-period EMA (4,285.538)** or the **17-period EMA (4,157.204)** to gather fresh demand.
### 📊 Tactical Parameters Summary:
* **Current Bias:** Neutral-Bullish / Apex Resistance Testing Node
* **Key Dynamic Resistance Ceiling:** 4,360.00 – 4,400.00
* **Immediate Dynamic Support (200-EMA):** 4,285.538
* **Secondary Dynamic Base (17-EMA):** 4,157.204
* **Macro Horizontal Floor:** 3,954.893
---
📊 **ChartPro Data**
*Precious Metals Architecture, Moving Average Confluences & Systematic Risk Management.*
⚠️ **Disclaimer:** For educational and informational purposes only. This active market study represents a personal trading framework and does not constitute financial or investment advice.

免责声明
这些信息和出版物并非旨在提供,也不构成TradingView提供或认可的任何形式的财务、投资、交易或其他类型的建议或推荐。请阅读使用条款了解更多信息。
免责声明
这些信息和出版物并非旨在提供,也不构成TradingView提供或认可的任何形式的财务、投资、交易或其他类型的建议或推荐。请阅读使用条款了解更多信息。