After Looking At " Daily Chart Time Frames"
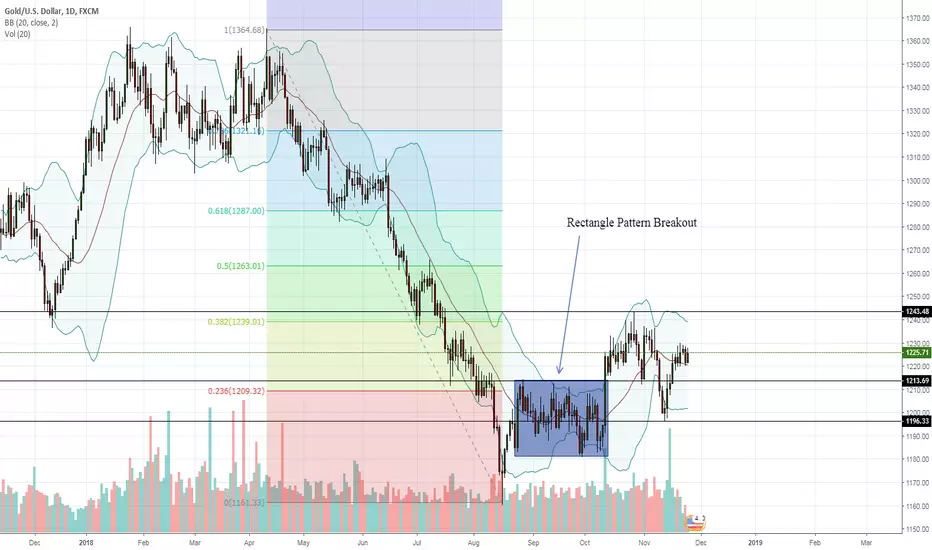
1.On 10th October 2018 There Was Rectangle Pattern Breakout .This Breakout is same on Weekly Chart 1214
That 1214 Is Strong Support Point For Gold
2.Recently on 13th Nov it traded one month low at 1196 So It Another Strongest Support
3.Looking at Fibonacci Level .38 any daily close above 1244 will be bullish Trend For Gold Till Target of 1280
 XAUUSDGOLD
On Fundamental Side : We are expecting High Unemployment rate for novemeber month in decemeber report and Higher number of non-farm payrolls Data
Secondly factor Which Can Lead Gold Upside Is Xi-Trump Meet
Third Is Brexit Event
Fourth is G20 Meeting Which Will Be another thing
For Investor and Traders who are looking to go long can go with stoploss of 1296 and target of 1264-1280
1.On 10th October 2018 There Was Rectangle Pattern Breakout .This Breakout is same on Weekly Chart 1214
That 1214 Is Strong Support Point For Gold
2.Recently on 13th Nov it traded one month low at 1196 So It Another Strongest Support
3.Looking at Fibonacci Level .38 any daily close above 1244 will be bullish Trend For Gold Till Target of 1280
XAUUSDGOLDOn Fundamental Side : We are expecting High Unemployment rate for novemeber month in decemeber report and Higher number of non-farm payrolls Data
Secondly factor Which Can Lead Gold Upside Is Xi-Trump Meet
Third Is Brexit Event
Fourth is G20 Meeting Which Will Be another thing
For Investor and Traders who are looking to go long can go with stoploss of 1296 and target of 1264-1280

免责声明
这些信息和出版物并非旨在提供,也不构成TradingView提供或认可的任何形式的财务、投资、交易或其他类型的建议或推荐。请阅读使用条款了解更多信息。
免责声明
这些信息和出版物并非旨在提供,也不构成TradingView提供或认可的任何形式的财务、投资、交易或其他类型的建议或推荐。请阅读使用条款了解更多信息。