Market Analysis: Gold Rockets Beyond $4,000
Market Analysis: Gold Rockets Beyond $4,000
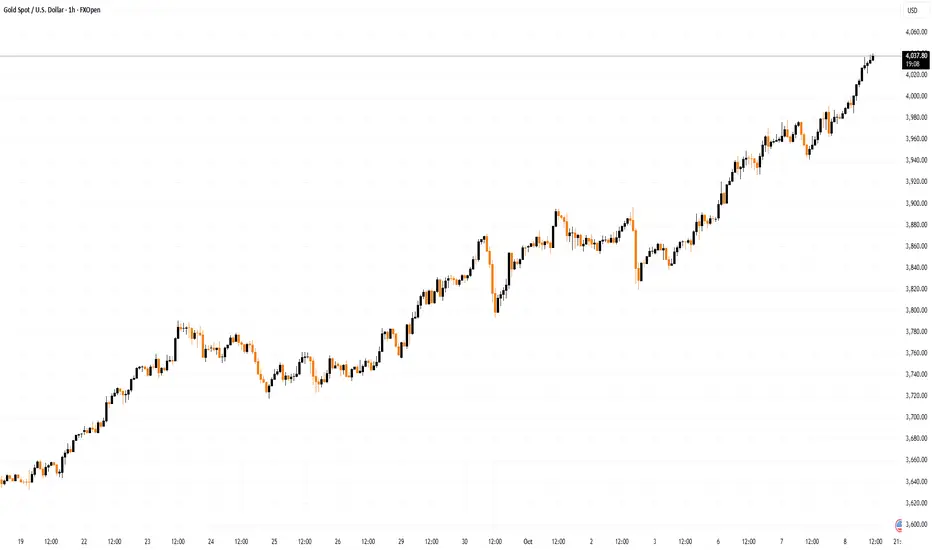
Gold price started a fresh surge above $4,000 and traded to a new all-time high.
Important Takeaways for Gold Price Analysis Today
- Gold price rallied to a new all-time high and traded above $4,000 against the US Dollar.
- A key bullish trend line is forming with support at $4,000 on the hourly chart of gold.
Gold Price Technical Analysis
On the hourly chart of Gold, the price formed support near $3,820. The price remained in a bullish zone and started a fresh increase above $3,900, as mentioned in the previous analysis.
The bulls pushed the price above $4,000 level and the 50-hour simple moving average. Finally, it traded to a new all-time high at $4,026. The price is still showing bullish signs above $4,020 and the RSI is above 70.

Initial support on the downside is near a key bullish trend line at $4,000. A downside break below the trend line might send the price to the 23.6% Fib retracement level of the upward move from the $3,822 swing low to the $4,026 high at $3,925.
If the bulls fail to protect $3,925, the price could start a larger downside correction. In the stated case, Gold could drop toward the 50% Fib retracement at $3,920. The next area of interest for the bulls might be $3,895. A daily close below $3,895 could spark bearish moves and send the price to $3,820.
If there is a fresh increase, the price could face resistance at $4,025. The next sell zone might be $4,050. An upside break above the $4,050 resistance could send Gold price toward $4,120. Any more gains may perhaps set the pace for an increase to $4,200.
This article represents the opinion of the Companies operating under the FXOpen brand only. It is not to be construed as an offer, solicitation, or recommendation with respect to products and services provided by the Companies operating under the FXOpen brand, nor is it to be considered financial advice.
Gold price started a fresh surge above $4,000 and traded to a new all-time high.
Important Takeaways for Gold Price Analysis Today
- Gold price rallied to a new all-time high and traded above $4,000 against the US Dollar.
- A key bullish trend line is forming with support at $4,000 on the hourly chart of gold.
Gold Price Technical Analysis
On the hourly chart of Gold, the price formed support near $3,820. The price remained in a bullish zone and started a fresh increase above $3,900, as mentioned in the previous analysis.
The bulls pushed the price above $4,000 level and the 50-hour simple moving average. Finally, it traded to a new all-time high at $4,026. The price is still showing bullish signs above $4,020 and the RSI is above 70.
Initial support on the downside is near a key bullish trend line at $4,000. A downside break below the trend line might send the price to the 23.6% Fib retracement level of the upward move from the $3,822 swing low to the $4,026 high at $3,925.
If the bulls fail to protect $3,925, the price could start a larger downside correction. In the stated case, Gold could drop toward the 50% Fib retracement at $3,920. The next area of interest for the bulls might be $3,895. A daily close below $3,895 could spark bearish moves and send the price to $3,820.
If there is a fresh increase, the price could face resistance at $4,025. The next sell zone might be $4,050. An upside break above the $4,050 resistance could send Gold price toward $4,120. Any more gains may perhaps set the pace for an increase to $4,200.
This article represents the opinion of the Companies operating under the FXOpen brand only. It is not to be construed as an offer, solicitation, or recommendation with respect to products and services provided by the Companies operating under the FXOpen brand, nor is it to be considered financial advice.

免责声明
这些信息和出版物并非旨在提供,也不构成TradingView提供或认可的任何形式的财务、投资、交易或其他类型的建议或推荐。请阅读使用条款了解更多信息。