
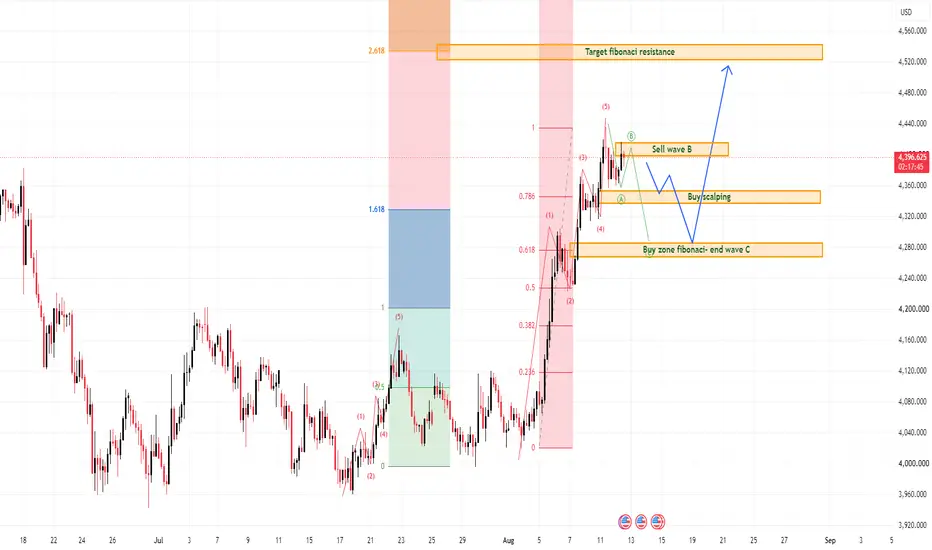
Gold is still holding a strong bullish structure after the sharp recovery from the lower accumulation base. From Kelly’s view, the current chart suggests that XAUUSD may be moving through a short-term ABC correction before continuing higher towards the Fibonacci resistance target.
The key idea is simple: gold remains bullish overall, but price may need a healthy pullback before the next upside wave becomes cleaner.
⟡ Market structure
The chart shows gold made a strong impulsive move from the lower area and reached the 4,390–4,430 region. After that, price started to slow down near the Sell wave B zone, which is normal after a strong rally.
Current price is trading around 4,394. This area is close to short-term resistance, so Kelly would not chase buys directly here. A controlled correction into support would create a better setup.
The first reaction zone is around 4,340–4,360, marked as the Buy scalping area. If the correction becomes deeper, the stronger support is around 4,270–4,290, where the chart marks the Fibonacci buy zone and possible end of wave C.
➤ Key levels
◌ 4,390–4,410: Sell wave B / current resistance reaction area
◌ 4,340–4,360: Buy scalping zone
◌ 4,270–4,290: Fibonacci buy zone / possible end wave C
◌ 4,520–4,540: Fibonacci 2.618 target resistance
◌ Below 4,270: area where the bullish setup starts to weaken
◌ Above 4,410: stronger bullish continuation confirmation
⌁ Elliott Wave view
From an Elliott Wave perspective, gold appears to have completed a strong bullish impulse and may now be forming a corrective ABC structure.
Wave A may be the first pullback from the recent high.
Wave B is reacting near the 4,390–4,410 resistance area.
Wave C may still pull price lower towards 4,340–4,360 or deeper into 4,270–4,290.
If wave C ends inside the Fibonacci buy zone and buyers defend it, gold may continue into the next bullish wave towards the 4,520–4,540 Fibonacci resistance target.
▸ Trading scenario
Preferred scenario: wait for gold to correct into support and show bullish confirmation.
Entry zone 1: 4,340–4,360 if bullish reaction appears
Entry zone 2: 4,270–4,290 if deeper ABC correction happens
Stop loss: below the confirmed wave C low or below 4,250
Take profit 1: 4,410
Take profit 2: 4,450
Take profit 3: 4,520–4,540
Alternative scenario: if gold breaks below 4,270 with strong bearish pressure, the bullish ABC setup weakens. In that case, price may need more time to rebuild support before the next upward continuation.
⌁ Kelly’s view
For Kelly, the main trend is still bullish, but the market is now near a resistance zone after a strong rally. The better plan is patience.
If gold corrects into 4,340–4,360 or 4,270–4,290 and buyers defend the zone, the next bullish wave may continue towards the Fibonacci 2.618 target.
Gold remains in a bullish structure.
A clean ABC pullback may prepare the next move higher.
Share your view below.

📌 New analysis published daily
🔔 Follow this profile for real-time updates
⚠️ This is personal analysis, not financial advice
Daily GOLD and Forex updates: t.me/+SOSI26CZOJ1mZDhl
🔔 Follow this profile for real-time updates
⚠️ This is personal analysis, not financial advice
Daily GOLD and Forex updates: t.me/+SOSI26CZOJ1mZDhl
相关出版物
免责声明
这些信息和出版物并非旨在提供,也不构成TradingView提供或认可的任何形式的财务、投资、交易或其他类型的建议或推荐。请阅读使用条款了解更多信息。
📌 New analysis published daily
🔔 Follow this profile for real-time updates
⚠️ This is personal analysis, not financial advice
Daily GOLD and Forex updates: t.me/+SOSI26CZOJ1mZDhl
🔔 Follow this profile for real-time updates
⚠️ This is personal analysis, not financial advice
Daily GOLD and Forex updates: t.me/+SOSI26CZOJ1mZDhl
相关出版物
免责声明
这些信息和出版物并非旨在提供,也不构成TradingView提供或认可的任何形式的财务、投资、交易或其他类型的建议或推荐。请阅读使用条款了解更多信息。