
Dear all,
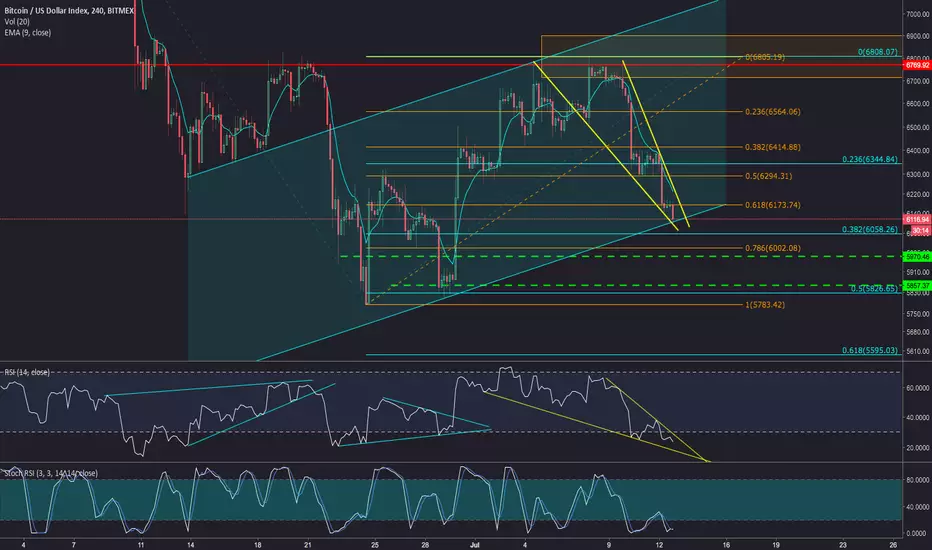
A quick chart on how I am monitoring BTC right now.
I see a lot of bullish signs on this red days, like we shall see a lot of bearish signs after several green days.
- RSI is bottomed
- Stoch RSI double bottom
- Parallel channel support
- Falling wedge
I'm a buyer with tight tight tight stops.
All the Best from the Crypto Space
A quick chart on how I am monitoring BTC right now.
I see a lot of bullish signs on this red days, like we shall see a lot of bearish signs after several green days.
- RSI is bottomed
- Stoch RSI double bottom
- Parallel channel support
- Falling wedge
I'm a buyer with tight tight tight stops.
All the Best from the Crypto Space
交易开始
That was quick :)注释
Upward breakout of the falling wedgeMonitoring BTC reaction to $6,400 with tight stop loss
注释
BTC bouncing on daily with SRSI oversold.
免责声明
这些信息和出版物并非旨在提供,也不构成TradingView提供或认可的任何形式的财务、投资、交易或其他类型的建议或推荐。请阅读使用条款了解更多信息。