
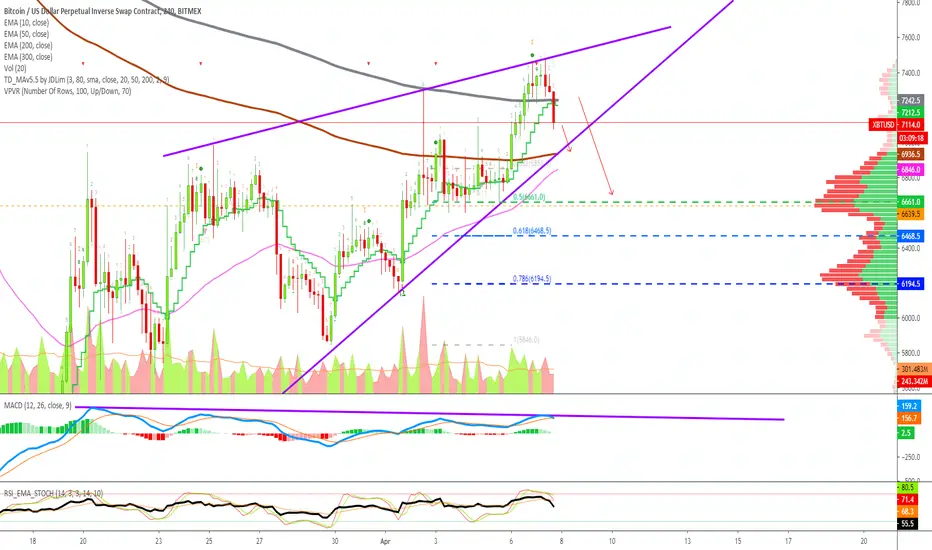
We are looking at bearish divergence for XBTUSD with the MACD.
Candles closed printing higher highs, while the MACD printed a lower high, giving us a strong bearish signal.
We also have prices breaking below EMA300 and EMA10.
This one is only confirmed once the 4H candle closes.
What these signals are telling us that XBTUSD can test lower support levels.
These support levels are marked and highlighted on the chart.
Conditions for change
If prices move back up and close above EMA300, the above signals become invalid.
Thanks a lot for reading.
Namaste.
Candles closed printing higher highs, while the MACD printed a lower high, giving us a strong bearish signal.
We also have prices breaking below EMA300 and EMA10.
This one is only confirmed once the 4H candle closes.
What these signals are telling us that XBTUSD can test lower support levels.
These support levels are marked and highlighted on the chart.
Conditions for change
If prices move back up and close above EMA300, the above signals become invalid.
Thanks a lot for reading.
Namaste.
注释
1H (EMA50 also gone)
Trading Cryptocurrencies can be the hardest undertaking ever without the right trade-numbers, without accurate private-access information. Free is free, but the best always requires sweat, an investment. Since 2017 👇
t.me/masteranandatrades/8778
t.me/masteranandatrades/8778
免责声明
这些信息和出版物并非旨在提供,也不构成TradingView提供或认可的任何形式的财务、投资、交易或其他类型的建议或推荐。请阅读使用条款了解更多信息。
Trading Cryptocurrencies can be the hardest undertaking ever without the right trade-numbers, without accurate private-access information. Free is free, but the best always requires sweat, an investment. Since 2017 👇
t.me/masteranandatrades/8778
t.me/masteranandatrades/8778
免责声明
这些信息和出版物并非旨在提供,也不构成TradingView提供或认可的任何形式的财务、投资、交易或其他类型的建议或推荐。请阅读使用条款了解更多信息。